Chorus One is now a part of Bitwise. Bitwise is a global, crypto-first asset manager with $11 billion+ in client assets and a diverse suite of investment solutions. Learn more about how Chorus One is growing as a part of Bitwise at onchain.bitwiseinvestments.com.
Oops! Something went wrong while submitting the form.
Fill in the form below to download the report
Thank you! Your submission has been received!
Oops! Something went wrong while submitting the form.
Fill in the form below to download the report
Thank you! Your submission has been received!
Oops! Something went wrong while submitting the form.
Fill in the form below to download the report
Thank you! Your submission has been received!
Oops! Something went wrong while submitting the form.
Crypto Research You Can Trust
The crypto space is evolving rapidly and can get daunting for investors. That is why we have a dedicated team of researchers who turn the complex technical advancements in the field into easily understandable research reports. These reports are highly valued by institutions and investors who want to stay up-to-date with the latest developments in the crypto world.
The State of Schedulers on Solana
Streaming, Batching, and the Economics of Execution Timing
The analysis focuses on evaluating the impact of Double Zero on Solana’s performance across three layers — gossip latency, block propagation, and block rewards.
Network layer:
DZ initially increased latency between geographically close peers (e.g., within Europe).
DZ reduced latency for distant peers (e.g., Europe <> Asia).
MTR tests between Oct 9–18 show hop count reduction and improved routing, confirming rapid backbone optimization.
Propagation layer:
Using shred_insert_is_full logs, block arrival times through DZ were initially delayed compared to the public Internet, but the gap narrowed over time.
Residual delay remains due to Turbine’s stake-weighted hierarchy and Europe’s high validator concentration, where small EU–EU latency increases amplify propagation depth.
Economic layer:
DZ-connected validators showed slightly higher and more volatile block fees before Oct 9, but no difference afterward.
A permutation test found a mean block fee delta of 0.000426 SOL (p-value of 0.1508), confirming results consistent with sampling variance rather than causal gain.
DZ-connected validators showed higher and more volatile block fees during the October market crash (10-11 October), with a mean block fee delta rises to $\sim$ 0.00499 SOL, with a corresponding p-value of 0.0559
Given the limited sample size and the proximity of the p-value to the 0.05 threshold, this result should be interpreted cautiously and necessitate further tests across different volatility regimes to confirm whether such transient advantages recur systematically
We see potential in DZ’s idea and recommend that validators outside Europe repeat similar measurements to assess regional effects, and help the community to understand what to improve.
We will continue to monitor DZ’s evolution and update these results as routing, adoption, and network integration progress.
Introduction
DoubleZero (DZ), is a purpose-built network underlay for distributed systems that routes consensus-critical traffic over a coordinated fiber backbone rather than the public Internet. The project positions itself as a routing, and policy controls tailored to validators and other latency-sensitive nodes. In practical terms, it provides operators with tunneled connectivity and a separate addressing plane, aiming to cut latency and jitter, smooth bandwidth, and harden nodes against volumetric noise and targeted attacks.
The design goal is straightforward, albeit ambitious: move the heaviest, most timing-sensitive parts of blockchain networking onto dedicated fiber-optic and subsea cables. In DoubleZero’s framing, that means prioritizing block propagation and transaction ingress, reducing cross-continent tail latency, and stripping malformed or spammy traffic before it hits validator sockets.
Solana’s throughput is gated as much by network effects as by execution, so any reduction in leader-to-replica and replica-to-leader propagation delays can translate into higher usable TPS. Overall, DoubleZero expects real-world performance on mainnet to improve substantially as the network is adopted by the validator cluster. Reducing latency by up to 100ms (including zero jitter) along some routes, and increasing bandwidth available to the average Solana validator tenfold.
In this article, we evaluate the effects of DoubleZero on the Solana network by comparing its performance with that of the public Internet. We measure how the use of DZ influences network latency, throughput, and block propagation efficiency, and we assess if these network-level changes translate into differences in slot extracted value.
Methodology for Latency Measurements
Solana validators natively report gossip-layer round-trip time (RTT) through periodic ping–pong messages exchanged among peers. These measurements are logged automatically by the validator process and provide a direct view of peer-to-peer latency at the protocol level, as implemented in the Agave codebase.
To assess the impact of DoubleZero, we analyzed these validator logs rather than introducing any external instrumentation. Two machines with identical hardware and network conditions, co-located were used. We refer to them as Identity 1 and Identity 2 throughout the analysis.
In addition to gossip-layer RTT, we also examined block propagation time, which represents the delay between when a block is produced by the leader and when it becomes fully available to a replica. For this, we relied on the shred_insert_is_full log event emitted by the validator whenever all shreds of a block have been received and the block can be reconstructed locally. This event provides a precise and consistent timestamp for block arrival across validators, enabling a direct comparison of propagation delays between the two identities.
We chose shred_insert_is_full instead of the more common bank_frozen event because the latter only helps in defining the jitter. A detailed discussion of this choice is provided in the Appendix.
The experiment was conducted across seven time windows:
Window 1: both validators connected via the public Internet.
Window 2:Identity 2 connected through DZ, while Identity 1 remained on the public Internet. At this stage, less than 25% of the network stake was connected to DZ.
Window 3: half-day interval with both validators again connected via the public Internet (baseline for comparison with Window 4).
Window 4: half-day interval with Identity 2 connected through DZ, and Identity 1 on the public Internet. The stake connected DZ remained below 25%.
Window 5: data collected during the market flash crash on 10 October, with Identity 2 connected through DZ and Identity 1 on the public Internet. Here, approximately 30% of the stake was connected to DZ.
Window 6: post-crash period, same configuration as Window 5, with about 30% of stake connected through DZ.
Window 7: This overlaps with window 6 and represents the largest dataset in terms of sample size with most recent data (end date - 2025.10.17).
This alternating setup enables us to disentangle two sources of variation: intrinsic differences due to hardware, time-of-day, and network conditions, and the specific effects introduced by routing one validator through DZ. The resulting RTT distributions offer a direct measure of how DoubleZero influences gossip-layer latency within the Solana network.
Effects on Solana Network
This section examines how Double Zero influences the Solana network at three complementary levels: peer-to-peer latency, block propagation, and validator block rewards. We first analyze changes in gossip-layer RTT to quantify DZ’s direct impact on communication efficiency between validators. We then study block propagation times derived from the shred_insert_is_full event to assess how modified RTTs affects block dissemination. Finally, we investigate fee distributions to determine whether DZ yield measurable differences in extracted value (EV) across slots. Together, these analyses connect the network-level effects of DZ to their observable consequences on Solana’s operational and economic performance.
Gossip-Layer Round-Trip Time
The gossip layer in Solana functions as the control plane: it handles peer discovery, contact-information exchange, status updates (e.g., ledger height, node health) and certain metadata needed for the data plane to operate efficiently. Thus, by monitoring RTT in the gossip layer we are capturing a meaningful proxy of end-to-end peer connectivity, latency variability, and the general health of validator interconnectivity. Since the effectiveness of the data plane (block propagation, transaction forwarding) depends fundamentally on the control-plane’s ability to keep peers informed and connected, any reduction in gossip-layer latency can plausibly contribute to faster, more deterministic propagation of blocks or shreds.
Fig.1: Empirical probability density functions (PDFs) of gossip-layer round-trip time (RTT) for all peers observed by Identity 1 and Identity 2 across four experimental windows. Vertical dashed lines indicate median RTT values for each identity. The distributions capture peer-to-peer latency across the entire gossip mesh. Here (w DZ) means the identity is connected to DoubleZero, while (w/o DZ) means the identity is not connected to DoubleZero.
In Figure 1, we present the empirical probability density functions (PDFs) of gossip-layer round-trip time (RTT) from our two identities under different experimental windows.
Across all windows, the RTT distributions are multimodal, which is expected in Solana’s gossip layer given its geographically diverse network topology. The dominant mode below 20–30 ms likely corresponds to peers located in the same region or data center, while the secondary peaks around 80–120 ms and 200–250 ms reflect transcontinental routes (for instance, between North America and Europe or Asia).
In Windows 1 and 4, when both validators used the public Internet, the RTT distributions for Identity 1 and Identity 2 largely overlap. Their medians mostly coincide, and the overall shape of the distribution is very similar, confirming that the two machines experience comparable baseline conditions and that intrinsic hardware or routing differences are negligible.
A mild divergence appears in Windows 6 and 7, when Identity 2 is connected through DZ. The median RTT of Identity 2 shifts slightly to the right, indicating a small increase in the typical round-trip time relative to the public Internet baseline. This shift is primarily driven by a dilution of the fast peer group: the density of peers within the 10–20 ms range decreases, while that population redistributes toward higher latency values, up to about 50–70 ms. For longer-distance modes (around 80–100 ms and beyond) it seems the RTT is largely unaffected.
Overall, rather than a uniform improvement, these distributions suggest that DZ introduces a small increase in gossip-layer latency for nearby peers, possibly reflecting the additional routing path through the DZ tunnel.
Fig.2: Empirical probability density functions (PDFs) of gossip-layer round-trip time (RTT) for validator IPs observed by Identity 1 and Identity 2 across four experimental windows. Vertical dashed lines indicate median RTT values for each identity. Here (w DZ) means the identity is connected to DoubleZero, while (w/o DZ) means the identity is not connected to DoubleZero.
When focusing exclusively on validator peers, the distributions confirm the effect of DZ on nearby peers (below 50 ms). However, a clearer pattern emerges for distant peers—those with RTTs exceeding roughly 70–80 ms. In Windows 6 and 7, where Identity 2 is connected through DZ, the peaks in the right tail of the PDF shifts to te left, signaling a modest but consistent reduction in latency for long-haul validator connections.
Despite this gain, the behaviour of median RTT remains almost unaffected: it increases when connecting to DoubleZero. Most validators are located within Europe, so the aggregate distribution is dominated by short- and mid-range connections. Consequently, while DZ reduces latency for a subset of geographically distant peers, this improvement is insufficient to significantly shift the global RTT distribution’s central tendency.
Fig.3: Gossip-layer round-trip time (RTT) distributions for selected validator peers (identified by IP) with median RTT below 60 ms. Blue-colored boxes represent Identity 1 (always on the public Internet), and red-colored boxes represent Identity 2 (connected through DZ in Windows 6–7). The orange line inside each box indicates the median RTT. Here (w DZ) means the identity is connected to DoubleZero, while (w/o DZ) means the identity is not connected to DoubleZero.
In order to better visualize the effect highlighted from Fig. 2, we can focus on individual validator peers located within the 60 ms latency range, see Fig. 3. These results confirm that the modest rightward shift observed in the aggregate distributions originates primarily from local peers, whose previously low latencies increase slightly when routed through DZ. For example, the peer 67.213.127.33 (Amsterdam) moves from a median RTT below 10 ms in the baseline window to above 20 ms under DZ. Similar, though less pronounced, upward shifts occur for several other nearby peers.
Fig.4: Gossip-layer round-trip time (RTT) distributions for selected validator peers (identified by IP) with median RTT above 100 ms. Blue-colored boxes represent Identity 1 (always on the public Internet), and red-colored boxes represent Identity 2 (connected through DZ in Windows 6–7). The orange line inside each box indicates the median RTT. Here (w DZ) means the identity is connected to DoubleZero, while (w/o DZ) means the identity is not connected to DoubleZero.
For distant validators, the introduction of DoubleZero systematically shifts the median RTT downward, see Fig. 4. This improvement is especially evident for peers such as 15.235.232.142 (Singapore), where the entire RTT distribution is displaced toward lower values and the upper whiskers contract, suggesting reduced latency variance. The narrowing of the boxes in many cases further implies improved consistency in round-trip timing.
Taken together, these results confirm that DZ preferentially benefits geographically distant peers, where conventional Internet routing is less deterministic and often suboptimal. The impact, while moderate in absolute terms, is robust across peers and windows, highlighting DZ’s potential to improve inter-regional validator connectivity without increasing jitter.
Overall, these results capture a snapshot of Double Zero’s early-stage performance. As we will show in the next subsection, the network has improved markedly since its mainnet launch. A comparison of MTR tests performed on October 9 and October 18 highlights this evolution. Initially, routes between Amsterdam nodes (79.127.239.81 → 38.244.189.101) involved up to seven intermediate hops with average RTTs around 24 ms, while the Amsterdam–Frankfurt route (79.127.239.81 → 64.130.57.216) exhibited roughly 29 ms latency and a similar hop count. By mid-October, both paths had converged to two to three hops, with RTTs reduced to ~2 ms for intra-Amsterdam traffic and ~7 ms for Amsterdam–Frankfurt. This reduction in hop count and latency demonstrates tangible routing optimization within the DZ backbone, suggesting that path consolidation and improved internal peering have already translated into lower physical latency.
Block Dissemination Latency
In Solana, the time required to receive all shreds of a block offers a precise and meaningful proxy for block propagation time. Each block is fragmented into multiple shreds, which are transmitted through the Turbine protocol, a tree-based broadcast mechanism designed to efficiently distribute data across the validator network. When a validator logs the shred_insert_is_full event, it indicates that all expected shreds for a given slot have been received and reassembled, marking the earliest possible moment at which the full block is locally available for verification. This timestamp therefore captures the network component of block latency, isolated from execution or banking delays.
However, the measure also reflects the validator’s position within Turbine’s dissemination tree. Nodes closer to the root—typically geographically or topologically closer to the leader—receive shreds earlier, while those situated deeper in the tree experience higher cumulative delays, as each hop relays shreds further downstream. This implies that differences in block arrival time across validators are not solely due to physical or routing latency, but also to the validator’s assigned role within Turbine’s broadcast hierarchy. Consequently, block arrival time must be interpreted as a convolution of propagation topology and network transport performance.
The figure below presents the empirical probability density functions (PDFs) of latency differences between our two validators, measured as the time difference between the shred_insert_is_full events for the same slot. Positive values correspond to blocks arriving later at Identity 2 (the validator connected through Double Zero).
Fig.5: Empirical probability density functions (PDFs) of block dissemination latency, measured as the time difference in receiving all shreds for the same slot between the two validators (Identity 2 – Identity 1). Positive values indicate blocks arriving later at the DZ-connected validator. Here (w DZ) means the identity is connected to DoubleZero, while (w/o DZ) means the identity is not connected to DoubleZero.
In the early windows (2 and 3), when Double Zero was first deployed, the distribution exhibits a pronounced right tail, indicating that blocks frequently arrived substantially later at the DZ-connected validator. This confirms that during the initial deployment phase, DZ added a measurable delay to block dissemination, consistent with the higher peer latency observed in the gossip-layer analysis.
Over time, however, the situation improved markedly. In windows 5–7, the right tail becomes much shorter, and the bulk of the distribution moves closer to zero, showing that block arrival delays through DZ decreased substantially. Yet, even in the most recent window, the distribution remains slightly right-skewed, meaning that blocks still tend to reach the DZ-connected validator marginally later than the one on the public Internet.
This residual offset is best explained by the interaction between stake distribution and Turbine’s hierarchical structure. In Solana, a validator’s likelihood of occupying an upper position in the Turbine broadcast tree increases with its stake weight. Since the majority of Solana’s stake is concentrated in Europe, European validators are frequently placed near the top of the dissemination tree, receiving shreds directly from the leader or after only a few hops. When a validator connects through Double Zero (DZ), however, we have seen that EU–EU latency increases slightly compared to the public Internet. As a result, even if the DZ-connected validator occupies a similar topological position in Turbine, the added transport latency in the local peer group directly translates into slower block arrival times. Therefore, the persistent right-skew observed in the distribution is primarily driven by the combination of regional stake concentration and the modest latency overhead introduced by DZ in short-range European connections, rather than by a deeper tree position or structural topology change.
Fig. 6: Empirical probability density functions (PDFs) of latency differences between validators for blocks proposed by leaders connected through Double Zero (DZ), grouped by leader region.
To further assess the geographical component of Double Zero’s (DZ) impact, we isolated slots proposed by leaders connected through DZ and grouped them by leader region. For leaders located in more distant regions such as Tokyo, DZ provides a clear advantage: the latency difference between identities shifts leftward, indicating that blocks from those regions are received faster through DZ. Hence, DZ currently behaves as a latency equalizer, narrowing regional disparities in block dissemination rather than uniformly improving performance across all geographies.
Fig. 7: Block Compute Units (in Millions) versus the latency of Identity 2 respect to Identity 1. Here, Identity 2 is connected to DoubleZero.
Fig. 8: Block Compute Units (in Millions) versus the latency of Identity 2 respect to Identity 1. Here, Identity 2 is connected to DoubleZero. We restricted only to slots proposed by leader connected to DoubleZero, and divided by region.
Finally, we see no correlation between block size (in terms of Compute Units) and propagation time.
Block Rewards
It has been demonstrated that timing advantages can directly affect validator block rewards on Solana, as shown in prior research. However, in our view, this phenomenon does not translate into an organic, system-wide improvement simply by reducing latency at the transport layer. The benefit of marginal latency reduction is currently concentrated among a few highly optimized validators capable of exploiting timing asymmetries through sophisticated scheduling or transaction ordering strategies. In the absence of open coordination mechanisms—such as a block marketplace or latency-aware relay layer—the overall efficiency gain remains private rather than collective, potentially reinforcing disparities instead of reducing them.
Since any network perturbation can in principle alter the outcome of block rewards, we tested the specific effect of DoubleZero on extracted value (EV). Building on the previously observed changes in block dissemination latency, we examined whether routing through DZ produces measurable differences in block EV—that is, whether modifying the underlying transport layer influences the value distribution of successfully produced slots.
Fig. 9: 24-hour sliding window statistics of block fees (in SOL) for validators connected through Double Zero versus others. Solid lines represent the mean, shaded areas denote the 5th–95th percentile range, and dashed lines indicate sample sizes. Source from Dune Analytics https://dune.com/queries/5998245
Figure 9 compares validators connected through DoubleZero with other validators in terms of block fees, used here as a proxy for extracted value (EV). Each line represents a 24-hour sliding window average, while shaded regions correspond to the 5th–95th percentile range. Dashed lines on the secondary axis show the sample size over time.
Before October 9, DZ-connected validators exhibit a slightly higher mean and upper percentile (p95) for block fees, together with larger fluctuations, suggesting sporadic higher-value blocks. During the market crash period (October 10–11), this difference becomes temporarily more pronounced: the mean block fee for DZ-connected validators exceeds that of others, with the p95 moving widely above. After October 11, this pattern disappears, and both groups show virtually identical distributions.
To verify whether the pre–October 9 difference and the market crash upside movement reflected a real effect or a statistical artifact, we applied a permutation test on the average block fee, cfr. Dune queries 5998293 and 6004753. This non-parametric approach evaluates the likelihood of observing a mean difference purely by chance: it repeatedly shuffles the DZ and non-DZ labels between samples, recalculating the difference each time to build a reference distribution under the null hypothesis of no effect.
The resulting mean block fee delta of 0.00043 SOL with p-value of 0.1508 during the period pre–October 9 indicates that the observed difference lies well within the range expected from random sampling. In other words, the apparent gain is not statistically meaningful and is consistent with sample variance rather than a causal improvement due to DZ connectivity. When restricting the analysis to the market crash period (October 10–11), the difference in mean extracted value (EV) between DZ-connected and other validators becomes more pronounced. In this interval, the mean block fee delta rises to $\sim$ 0.00499 SOL, with a corresponding p-value of 0.0559. This borderline significance suggests that under high-volatility conditions—when order flow and transaction competition intensify—reduced latency on long-haul routes may temporarily yield measurable EV gains.
However, given the limited sample size and the proximity of the p-value to the 0.05 threshold, this result should be interpreted cautiously: it may reflect short-term network dynamics rather than a persistent causal effect. Further tests across different volatility regimes are needed to confirm whether such transient advantages recur systematically.
Conclusions
This study assessed the effects of Double Zero on the Solana network through a multi-layer analysis encompassing gossip-layer latency, block dissemination time, and block rewards.
At the network layer, Solana’s native gossip logs revealed that connecting a validator through DZ introduces an increase in round-trip time among geographically close peers within Europe, while simultaneously reducing RTT for distant peers (e.g., intercontinental connections such as Europe–Asia). This pattern indicates that DZ acts as a latency equalizer, slightly worsening already short paths but improving long-haul ones. Over time, as the network matured, overall latency performance improved. Independent MTR measurements confirmed this evolution, showing a sharp reduction in hop count and end-to-end delay between October 9 and October 18, consistent with substantial optimization of the DZ backbone.
At the propagation layer, analysis of shred_insert_is_full events showed that the time required to receive all shreds of a block — a proxy for block dissemination latency — improved over time as DZ routing stabilized. Early measurements exhibited longer block arrival times for the DZ-connected validator, while later windows showed a markedly narrower latency gap. Nevertheless, blocks still arrived slightly later through DZ, consistent with Solana’s Turbine topology and stake distribution: since most high-stake validators are located in Europe and thus likely occupy upper levels in Turbine’s broadcast tree, even small EU–EU latency increases can amplify downstream propagation delays.
At the economic layer, we examined block fee distributions as a proxy for extracted value (EV). DZ-connected validators displayed slightly higher 24-hour average and upper-percentile fees before October 10, but this difference disappeared thereafter. A permutation test on pre–October 10 data confirmed that the apparent advantage is not statistically significant, and therefore consistent with random variation rather than a systematic performance gain.
Overall, the evidence suggests that DZ’s integration introduces mild overhead in local connections but provided measurable improvement for distant peers, particularly in intercontinental propagation. While these routing optimizations enhance global network uniformity, their economic impact remains negligible at the current adoption level.
Appendix - The frozen-bank events bias
A natural candidate for measuring block arrival time in Solana is the bank_frozen log event, which marks the moment when a validator completely recover a block in a given bank. However, this signal introduces a strong measurement bias that prevents it from being used to infer true block propagation latency.
The bank_frozen event timestamp is generated locally by each validator, after all shreds have been received, reconstructed, and the bank has been executed. Consequently, the recorded time includes not only the network component (arrival of shreds) but also:
the validator’s execution latency,
thread scheduling jitter, and
any clock desynchronization between machines
When comparing bank_frozen timestamps across validators, these effects dominate, producing a stationary random variable with zero mean and a standard deviation equal to the system jitter. This means that timestamp differences reflect internal timing noise rather than propagation delay.
Consider the following illustrative example.
In general, a local measurement for block time extracted from the bank_frozen event can be parametrized as
The figure below shows the distribution of time differences between bank_frozen events registered for the same slots across the two identities. As expected, the distribution is nearly symmetric around zero, confirming that the observed variation reflects only measurement jitter rather than directional latency differences.
A direct implication of this behaviour is the presence of an intrinsic bias in block time measurements as reported by several community dashboards. Many public tools derive slot times from the timestamp difference between consecutive bank_frozen events, thereby inheriting the same structural noise described above.
For instance, the Solana Compass dashboard reports a block time of 903.45 ms for slot 373928520. When computed directly from local logs, the corresponding bank_frozen timestamps yield 918 ms, whereas using the shred_insert_is_full events — which capture the completion of shred reception and exclude execution jitter — gives a more accurate value of 853 ms.
Similarly, for slot 373928536, the dashboard reports 419 ms, while the shred_insert_is_full–based estimate is 349 ms.
Timing games on Solana are economically rational, providing measurable validator revenue gains:
+3.0% in total rewards (27 basis points) from combining timing games and optimization.
+1.19% (8 basis points) from timing games on fees with default MEV behaviour.
+1.4% (12 basis points) from code optimization with no timing game.
We identify four key areas of impact: (1) inflation drift due to changes in slot duration, (2) TPS behaviour under slot manipulation, (3) CU efficiency variations, and (4) downstream slot leader effects.
Slot time manipulation increases CU per block and may result in higher TPS—even with fewer slots per unit time—by enabling more efficient transaction packing.
Firedancer achieves similar efficiency without slot delays, pointing to a likely implementation inefficiency in the Agave client.
No direct evidence supports cross-slot transaction stealing under timing games, but the presence of possible structural inefficiencies in Agave warrants further investigation.
Introduction
Blockchains are built to ensure both liveness and safety by incentivizing honest participation in the consensus process. However, most known consensus implementations are not fully robust against external economic incentives. While the overall behaviour tends to align with protocol expectations, certain conditions create incentives to deviate from the intended design. These deviations often exploit inefficiencies or blind spots in the consensus rules. When such actions degrade the protocol's overall performance, the protocol design needs to be fixed, otherwise people will simply keep exploiting these weaknesses.
In a world where data is the new oil, every millisecond has value. Information is converted into tangible gains by intelligent agents, and blockchain systems are no exception. This dynamic illustrates how time can be monetized. In Proof-of-Stake (PoS) systems, where block rewards are not uniformly distributed among participants, the link between time and value can create incentives for node operators to delay block production, effectively "exchanging time for a better evaluation." This behaviour stems from rewards not being shared. A straightforward solution would be to pool rewards and redistribute them proportionally, based on stake and network performance. Such a mechanism would eliminate the incentive to delay, unless all nodes collude, as any additional gains would be diluted across the network.
In this analysis, we evaluate the cost of time on Solana from both the operator’s and the network’s perspective.
Quantifying Incentives
It wasn’t long ago—May 31st, 2024—when Anatoly Yakovenko, in a Bankless episode, argued that timing games on Solana were unfeasible due to insufficient incentives for node operators. However, our recent tests indicate that, in practice, node operators are increasingly compelled to engage in latency optimization as a strategic necessity. As more operators exploit these inefficiencies, they raise the benchmark for expected returns, offering capital allocators a clear heuristic: prioritize latency-optimized setups. This dynamic reinforces itself, gradually institutionalizing the latency race as standard practice and pressuring reluctant operators to adapt or fall behind. The result is an environment where competitive advantage is no longer defined by protocol alignment, but by one’s readiness to exploit a persistent structural inefficiency. A similar dynamic is observed on Ethereum, see e.g. The cost of artificial latency in the PBS context, but on Solana the effect may be magnified due to its high-frequency architecture and tight block production schedule.
To test this hypothesis, we artificially introduced a delay of approximately 100ms in our slot timing (giving us an average slot time of 480ms) from June 25th to July 20th. The experiment was structured in distinct phases:
June 25th to July 2nd: We employed an optimized configuration for both block fees and tips, with 480ms slot time. This phase served as a baseline to observe the global effects of timing games under optimal conditions.
July 2nd to July 10th: We deliberately degraded bundle performance to isolate and measure the impact of timing games on block fees alone, excluding the influence of tips.
July 10th to July 20th: We restored the optimized setup while continuing to apply timing games, in order to examine their combined effect.
From July 20th onward: We have operated with the optimized configuration and no timing games, serving as a post-intervention baseline.
The decision to degrade bundle performance from July 2nd to July 10th was motivated by the strong correlation between fees and tips, which made it difficult to determine whether the observed effects of delay were attributable solely to bundle processing or to overall transaction execution. Data can be checked via our Dune dashboard here.
Analyzing the 24-hour moving average distribution of fees per block, we observe a consistent increase of approximately 0.005 SOL per block, regardless of bundle usage - we only observed a small relative difference compared to the case of optimized bundles. For a validator holding 0.2% of the stake, and assuming 432,000 slots per epoch, this translates to roughly 4.32 SOL per epoch, or about 790 SOL annually.
When MEV is factored in, the average fee difference per block increases by an additional 0.01 SOL. Due to the long-tailed distribution of MEV opportunities, this difference can spike up to 0.02 SOL per block, depending on market conditions. Interestingly, during periods of artificially low bundle usage, fees and tips begin to decouple, tips revert to baseline levels even under timing game conditions. This suggests that optimization alone remains a significant driver of performance.
However, as Justin Drake noted, when the ratio of ping time to block time approaches one, excessive optimization may become counterproductive. A striking example of this is Helius: despite being one of the fastest validators on Solana, it consistently ranks among the lowest in MEV rewards. This mirrors findings on Ethereum, where relays deliberately reduce optimization to preserve a few additional milliseconds for value extraction.
Extrapolating annualized returns across the three experimental phases—benchmarking against other institutional staking providers—we observe the following:
Timing games combined with optimization yield a 24.5% increase in fees and a 32.6% increase in MEV, resulting in an overall 3.0% uplift in total rewards, corresponding to a 27 basis point improvement in annualized return.
Timing games without bundle optimization lead to a 10.0% increase in fees, translating to an 8 basis point gain in annualized return.
Optimization without timing games produces a 3.3% increase in MEV and a 14.7% increase in fees, for a combined 1.4% boost in total rewards, or 12 basis points on annualized return.
Our analysis demonstrates that both timing games and latency optimization materially impact validator rewards on Solana. When combined, they produce the highest yield uplift—up to 3.0% in total rewards, or 27 basis points annually—primarily through increased MEV extraction and improved fee capture. However, even when used independently, both techniques deliver measurable gains. Timing games alone, without bundle optimization, still provide an 8 basis point boost, while pure optimization yields a 12 basis point increase.
These results challenge prior assumptions that the incentives on Solana are insufficient to support timing-based strategies. In practice, latency engineering and strategic delay introduce nontrivial financial advantages, creating a competitive feedback loop among operators. The stronger the economic signal, the more likely it is that latency-sensitive infrastructure becomes the norm.
Our findings point to a structural inefficiency in the protocol design. Individual actors, with rational behaviour under existing incentives, will always try to exploit these inefficiencies. We think that, the attention should be directed toward redesigning reward mechanisms—e.g., through pooling or redistribution—to neutralize these dynamics. Otherwise, the network risks entrenching latency races as a defining feature of validator competition, with long-term consequences for decentralization and fairness.
Quantifying Effects
In this section, we classify and quantify the main effects that arise from engaging in timing games. We identify four primary impact areas: (1) inflation rewards, (2) transactions per second (TPS), (3) compute unit (CU) usage per block, and (4) downstream costs imposed on the leader of subsequent slots.
Impact on Inflation
Inflation in Solana is defined annually but applied at the epoch level. The inflation mechanics involve three key components: the predefined inflation schedule, adjustments based on slot duration, and the reward distribution logic. These are implemented within the Bank struct (runtime/src/bank.rs), which converts epochs to calendar years using the slot duration as a scaling factor.
Slot duration is defined as ns_per_slot: u128 in Bank, derived from the GenesisConfig, with a default value of DEFAULT_NS_PER_SLOT = 400_000_000 (i.e., 400ms). Any deviation from this nominal value impacts real-world inflation dynamics.
The protocol computes the inflation delta per epoch using the nominal slot duration to derive the expected number of epochs per year (approximately 182.5), and thus the epoch fraction of a year (~0.00548). This delta is fixed and does not depend on the actual slot production speed. As a result, the effective annual inflation rate scales with the realized slot time: faster slots lead to more epochs per calendar year (higher total minting), while slower slots result in fewer epochs and thus reduced minting. For example:
At 390ms slot time:
Multiplier = 400 / 390 ~ 1.0256
Effective inflation = 102.56% of nominal → +2.56% real-time minting
At 500ms slot time:
Multiplier = 400 / 500 = 0.8
Effective inflation = 80% of nominal → −20% real-time minting
As shown in the corresponding plot, real slot times fluctuate around the 400ms target. However, if a sufficient share of stake adopts timing games, average slot time may systematically exceed the nominal value, thereby suppressing overall staking yields. This effect introduces a distortion in the economic design of the protocol: slower-than-target slot times reduce total inflationary rewards without explicit governance changes. While the additional revenue from MEV and fees may partially offset this decline, it typically does not compensate for the loss in staking yield.
Moreover, this creates a strategic window: node operators controlling enough stake to influence network slot timing can engage in timing games selectively—prolonging slot time just enough to capture extra fees and MEV, while keeping the average slot time close to the 400ms target to avoid noticeable inflation loss. This subtle manipulation allows them to extract value without appearing to disrupt the protocol’s economic equilibrium.
Impact on Transaction Per Second
TPS is often cited as a key performance metric for blockchains, but its interpretation is not always straightforward. It may seem intuitive that delaying slot time would reduce TPS—since fewer slots per unit time implies fewer opportunities to process transactions. However, this assumption overlooks a critical factor: longer slot durations allow more user transactions and compute units (CUs) to accumulate per block, potentially offsetting the reduction in block frequency.
Empirical evidence from our experiment supports this nuance. During the period of artificially delayed slots (~480ms), we observed a ~100 transaction increase per block compared to other validators running the standard Agave codebase (we will address Firedancer in the next section). Specifically, our configuration averaged 550 transactions per block at 480ms slot time, while the rest of the network, operating at an average 396ms, processed ~450 transactions per block.
This results in:
Delayed slots: 550 tx/block ÷ 0.48s = 1,146 TPS
Default slots: 450 tx/block ÷ 0.396s = 1,136 TPS
Thus, despite reducing block frequency, the higher transaction volume per block actually resulted in a net increase in TPS. This illustrates a subtle but important point: TPS is not solely a function of slot time, but of how transaction throughput scales with that time.
Impact on Compute Unit
CU per block is a more nuanced metric, requiring a broader temporal lens to properly assess the combined effects of block time and network utilization.
The first period of interest is January to February 2025, a phase marked by unusually high network activity driven by the meme coin season and the launch of various tokens linked to the Trump family. Notably, despite elevated traffic, we observe a dip in CU per block around January 19th, coinciding with the launch of the TRUMP token. This paradox—reduced CU per block during high demand—suggests an emerging inefficiency in block utilization.
At the time, the network-wide 24-hour moving average of CU per block remained significantly below the 48 million CU limit, with only rare exceptions. This indicates that, despite apparent congestion, blocks were not saturating compute capacity.
A structural shift occurred around February 13th, when approximately 88% of the network had upgraded to Agave v2.1.11. Following this, we observe a sharp and persistent drop in CU per block, implying a systemic change in block construction or scheduling behaviour post-upgrade. While several factors could be contributing—including transaction packing strategies, timing variance, and runtime-level constraints—this pattern underscores that software versioning and slot management can directly shape CU efficiency, especially under sustained demand.
Anomalous behavior in CU per block emerges when analyzing the data from March to April 2025. During this period, CU usage per block remained unusually low—oscillating between 30M and 40M CU, well below the 48M limit. This persisted until around March 15th, when a sharp increase in CU per block was observed. Not coincidentally, this date marks the point at which over 66% of the stake had upgraded to Agave v2.1.14.
Source: DeFiLlama
What makes this shift particularly interesting is its disconnect from network demand. A comparison with DeFi activity shows virtually no change between late February and early March. In fact, DeFi volumes declined toward the end of March, while CU per block moved in the opposite direction. This suggests that the rise in CU was not driven by increased user demand, but rather by validator behaviour or runtime-level changes introduced in the upgrade.
Throughout this period, the number of user transactions remained relatively stable. Notably, Firedancer (FD)—benchmarked via Asymmetric Research as a top-performing validator—began to include more transactions per block. FD also exhibited greater stability in CU usage, implying a more consistent packing and scheduling behaviour compared to Agave-based validators.
These observations suggest that CU per block is not merely a reflection of demand, but is heavily influenced by validator software, packing logic, and runtime decisions. The sharp rise in CU post-upgrade, despite declining network activity, points to a protocol-level shift in block construction rather than any endogenous change in user behaviour.
Notably, around April 14th, we observe a widening in the spread of CU per block across validators. This timing aligns with the effective increase in the maximum CU limit from 48M to 50M, suggesting that validators responded differently to the expanded capacity. Interestingly, FD maintained a remarkably stable CU usage throughout this period, indicating consistency in block construction regardless of the network-wide shift.
What emerges during this phase is a growing divergence between early adopters of timing games and fast, low-latency validators (e.g., Chorus One and Helius). While the former began pushing closer to the new CU ceiling, leveraging additional time per slot to pack more transactions, the latter maintained tighter timing schedules, prioritizing speed and stability over maximal CU saturation.
The picture outlined so far suggests a wider client-side inefficiency, where performance-first optimization—particularly among Agave-based validators—results in suboptimal block packaging. This is clearly highlighted by Firedancer (FD) validators, which, despite not engaging in timing games, consistently approached block CU saturation, outperforming vanilla Agave nodes in terms of block utilization efficiency.
Yet, during the same period, FD validators reached comparable levels of CU saturation—without modifying slot time—simply through better execution. This reinforces the view that the observed discrepancy is not a protocol limitation, but rather a shortcoming in the current Agave implementation. In our view, this represents a critical inefficiency that should be addressed at the client level, as it introduces misaligned incentives and encourages timing manipulation as a workaround for otherwise solvable engineering gaps.
On Transaction Slot Boundaries
This brings us to the final piece of the puzzle. On Ethereum, prior research has shown that delaying slot time can enable the validator of slot N to “steal” transactions that would otherwise have been processed by the validator of slot N+1. On Solana, however, the dynamics appear fundamentally different.
While it is difficult to prove with absolute certainty that slot delayers are not aggregating transactions intended for subsequent slots, there are strong indications that this is not the mechanism at play. In our experiment, we only altered Proof of History (PoH) ticking, effectively giving the Agave scheduler more time to operate, without modifying the logic of transaction selection.
Agave’s scheduler is designed to continuously process transactions based on priority, and this core behaviour was never changed. Importantly, Firedancer's performance—achieving similar block utilization without delaying slot time—strongly suggests that the observed improvements from timing games stem from enhanced packaging efficiency, not frontrunning or cross-slot transaction capture.
Furthermore, when we examine the number of user transactions and CU per block for slots immediately following those subject to timing games, we observe that subsequent leaders also benefit from the delayed PoH, even when running an unmodified, vanilla Agave client, cfr. here. Compared to the network-wide baseline, these leaders tend to produce blocks with higher transaction counts and CU utilization, suggesting that the slower PoH cadence indirectly improves scheduler efficiency for the next slot as well. In other words, the gains from timing games can partially spill over to the next leader, creating second-order effects even among non-participating validators.
In this light, the extended time appears to function purely as a buffer for suboptimal packing logic in the Agave client, not as a window to re-order or steal transactions. This further supports the argument that what we’re observing is not a protocol-level vulnerability, but rather an implementation-level inefficiency that can and should be addressed.
Conclusions
This document has provided a quantitative and qualitative analysis of timing games on Solana, focusing on four critical dimensions: inflation rewards, transactions per second (TPS), compute unit (CU) utilization, and costs imposed on the next leader.
We began by quantifying the incentives: timing games are not just viable—they’re profitable. Our tests show that:
Combining timing games and optimization yields a 3.0% uplift in validator rewards, or 27 basis points annually.
Timing games alone (without affecting bundle for MEV) still yield a 0.8% gain (8 basis points).
Optimization w/o Slot Delay provides a 1.4% increase (12 basis points), mainly through better CU and MEV extraction.
In the case of inflation, we showed that slot-time manipulation alters the effective mint rate: longer slots reduce inflation by decreasing epoch frequency, while shorter slots accelerate issuance. These effects accumulate over time and deviate from the intended reward schedule, impacting protocol-level economic assumptions.
For TPS, we countered the intuition that longer slots necessarily reduce throughput. In fact, because longer slots allow for higher transaction counts per block, we observed a slight increase in TPS, driven by better slot-level utilization.
The most revealing insights came from analyzing CU per block. Despite similar user demand across clients, Firedancer consistently saturated CU limits without altering slot timing. In contrast, Agave validators required delayed slots to match that efficiency. This points not to a network-level bottleneck but to a client-side inefficiency in Agave’s transaction scheduler or packing logic.
Finally, we investigated concerns around slot-boundary violations. On Ethereum, delayed blocks can allow validators to “steal” transactions from the next slot. On Solana, we found no strong evidence of this. The PoH delay only extends the scheduling window, and Agave’s priority-based scheduler remains unmodified. Firedancer’s comparable performance under standard timing supports the conclusion that the extra slot time is used purely for local block optimization, not frontrunning.
Altogether, the evidence suggests that timing games are compensating for implementation weaknesses, not exploiting protocol-level vulnerabilities. While we do not assert the presence of a critical bug, the consistent underperformance of Agave under normal conditions—and the performance parity achieved through slot-time manipulation—raises valid concerns. Before ending the analysis, it is worth mentioning that the idea of a bug, with more context around it, has been provided by the Firedancer team as well here.
Solana is entering a new era with the launch of the Block Assembly Marketplace (BAM), announced by Jito.
The architecture introduces block builders (BAM nodes) operating within Trusted Execution Environments (TEEs) to protect transaction privacy and enforce block integrity.
This effectively brings a Proposer-Builder Separation (PBS) to Solana, where transaction sequencing (builders) is decoupled from block validation (validators).
Plugins, or interfaces that interact with BAM nodes, enable previously impractical use cases and introduce a new economic layer to the network, adding L2-like flexibility directly within Solana’s core transaction pipeline.
The architecture is designed to limit toxic MEV, but risks remain, including unencrypted orderflow leakage, enforcement of validator execution integrity, and the potential for permissionless Plugin misuse.
Additional challenges include builder centralization and the technical and adoption hurdles of running TEEs across the network.
Introduction
At Solana Accelerate in May, Anza introduced Alpenglow, a new consensus mechanism capable of finalizing blocks in as little as 150ms. Overhauling consensus is a colossal task for any blockchain, but it’s just one of the major changes coming to Solana in the months ahead.
This week, Jito, a core piece in Solana’s infrastructure, announced the Block Assembly Marketplace (BAM). Together, Alpenglow and BAM completely rethink how Solana works. The new architecture will enable use cases previously out of reach, introduce new economic dynamics, reduce toxic MEV, and lay the groundwork for broader institutional adoption.
In this article, we’ll explore what’s changing, what it means for the network, validators, and users, and the challenges ahead.
The BAM Era
At the heart of Solana’s upcoming infrastructure overhaul is the Block Assembly Marketplace (BAM). It introduces several changes:
BAM nodes will replace the current relayers and decentralize Block Engine. These nodes receive transactions directly from RPCs and validators and operate within Trusted Execution Environments (TEEs), which allow them to run encrypted mempools that protect orderflow from leaking and ensure execution integrity.
Plugins, or modular applications that live on top of BAM nodes, will enable novel use cases and introduce a new layer of economy to the network.
Validators will continue to propose and validate blocks, but BAM nodes will handle transaction scheduling.
Here’s what the new transaction flow looks like:
A lot is happening here, so let’s break it down step by step.
Trusted Execution Environments
Solana's new architecture is inspired by Flashbots' BuilderNet, where Trusted Execution Environments (TEEs) play a central role. TEEs are isolated areas within processors (like Intel SGX or Intel TDX) that protect data and code execution from all external access.
In Solana’s upcoming design, TEEs enable:
Encrypted mempools: Transactions are submitted to an encrypted mempool inside the TEE. This prevents third parties, including the host machine, from accessing transaction details.
Verifiable attestations: TEEs will generate cryptographic proofs of transaction ordering. These attestations can be publicly verified, pressuring validators to execute transactions exactly as the BAM node proposed.
The use of TEEs also comes with trade-offs. Their security has been questioned, and there’s even a dedicated site, sgx.fail, that tracks known vulnerabilities in Intel’s SGX platform. Common attack vectors include side-channel attacks (e.g., Spectre) or hardware-level vulnerabilities (e.g., Plundervolt). However, if such an attack is launched against Solana, the most severe likely consequence might be transaction reordering, including sandwiches, an arguably acceptable cost for revealing a vulnerability.
BAM Nodes
In the current Jito architecture, RPC nodes and validators send transactions to a relayer, the current leader (i.e., the validator building the block), and a few upcoming leaders. The relayer filters these transactions and passes them to the block engine. Meanwhile, MEV searchers create transaction bundles and also submit them to the block engine. The block engine then processes and forwards these transactions and bundles to the validators for inclusion in the block.
The new architecture changes this. BAM nodes take over the roles of both the block engine and the relayer. These specialized nodes receive transactions from RPCs, sequence them, and forward to validators. This effectively introduces Proposer-Builder Separation (PBS) to Solana.
Another feature of BAM nodes is support for customizable schedulers, which allow developers to influence the block-building process through Plugin apps.
Initially, Jito will operate all BAM nodes. Over time, the plan is to expand to a permissioned set of operators, with the long-term goal of supporting a permissionless model.
Plugins
One of the most exciting innovations in the new Jito architecture is the introduction of Plugins, or interfaces that interact with BAM nodes. These plugins can access live transaction streams and use custom logic to influence ordering or insert their own transactions. While the scheduler still determines final ordering, plugins can use priority fees to shape block composition.
This opens up new possibilities for both developers and users. It also aligns with Solana’s IBRL philosophy, enabling new use cases that push the limits of what Solana currently supports.
From an economic standpoint, plugins introduce a revenue-sharing model that can benefit validators, delegators, and developers. That said, open questions remain about how different plugins will interact with each other, and how their economics will evolve.
Because plugins run within TEEs, they have full access to incoming transactions. This means the Plugins’ permissionlessness must be significantly constrained; otherwise, it would risk enabling harmful MEV extraction.
A practical example of plugin potential is how they might improve Central Limit Order Book (CLOB) exchanges on Solana.
A Plugin-Powered Approach to CLOBs
CLOB exchanges let users place limit orders, specifying price, size, and direction. But building efficient, on-chain CLOBs on Solana is notoriously difficult due to:
Block times: Even with ~400ms block times, market makers typically need at least two slots (~0.8s) to place, cancel, or update orders. In practice, delays are often longer due to network congestion.
Account contention: Solana’s write lock model prevents parallel updates to shared states, like those operated in order books.
Bulk Trade offers a new approach: directly integrating the order book into the validator stack. Orders are received through a dedicated port, matched deterministically in 25ms cycles across validators, and aggregated into a net-delta commitment that’s later posted onchain.
The downside? Validators must run additional software, which is a tough sell.
However, with BAM, this ultra-fast order-matching functionality could be implemented as Pugin. That makes adoption far easier without requiring validators to manage separate systems.
Why Plugins Are Important
Plugins effectively extend Solana’s native capabilities. In this way, their role is comparable to that of L2s on Ethereum. However, because Plugins are built at the heart of Solana’s transaction pipeline, they contribute economic value to the network, rather than extracting it like traditional L2s often do.
That said, the approach isn’t without challenges, particularly for Plugins that must maintain shared state. Bulk Trade is a good example: its orders, cancellations, and fills need to be managed deterministically and synchronized across multiple nodes. The challenge is essentially a distributed consensus problem, but for high-frequency trading with sub-second finality. In such cases, the advancements in Alpenglow’s shred distribution system, Rotor, would hopefully provide meaningful support.
Ultimately, plugins bring three major benefits to Solana:
Unlock new developer potential, enabling previously impractical or too expensive applications to be built.
Remove latency bottlenecks, helping Solana stay true to its IBRL vision.
Create new revenue streams for developers, validators, and delegators.
BAM validators
In the current Solana architecture, validators handle both transaction sequencing and execution. The new model separates these responsibilities: transaction sequencing is delegated to BAM nodes, while validators are responsible for executing and validating the proposed blocks.
Here’s how it works:
BAM Validators receive pre-sequenced transaction bundles from BAM nodes.
Transactions are executed in FIFO order, based on the sequencing determined by the BAM scheduler.
If a validator executes transactions in a different order, it may be subject to penalties.
To support this model, BAM validators will run an updated version of the Jito-Solana client, which will be adapted to receive transactions from BAM nodes. In the future, BAM will integrate as a modular scheduler within Agave and Firedancer, allowing validators to leverage the optimized scheduling of BAM and the improved performance of these clients.
Assessing the Impact on Solana
The changes introduced by the new architecture fall into three categories:
Implementing Proposer-Builder Separation.
Enabling innovation through Plugins.
Limiting toxic MEV extraction.
It’s too early to say which will have the most significant impact, but each will substantially contribute to changing Solana’s economics and dynamics. Let’s start with PBS.
Proposer-Builder Separation (PBS)
So far, Ethereum is the only blockchain that has implemented PBS. Traditionally, validators build (select and order transactions) and propose (submit the block to the network). PBS splits these roles, introducing specialized builders alongside proposers.
The motivation is straightforward: specialized builders can construct more valuable blocks and extract MEV more efficiently. PBS helps address the fact that most validators lack the resources or sophistication to maximize block value on their own.
How Ethereum PBS Works
PBS is implemented on Ethereum offchain via a sidecar software called MEV-Boost. Here’s how it works:
Block Builders: scan the mempool, assemble blocks, and submit blind bids (including a fee for the proposer) to a marketplace.
Block Proposers (validators selected randomly per slot): choose the highest bid without seeing the block’s contents.
Relays: act as intermediaries, hiding block data until a proposer commits to a bid.
This model improves block quality but comes with trade-offs, especially around centralization.
Currently, two builders, Titan and Beaverbuild, create over 65% of blocks on Ethereum (down from over 80%). This makes block building the centralization hotspot in Ethereum’s transaction pipeline.
Much of this concentration comes from private transaction orderflow. Builders enter exclusive deals with wallets and exchanges to receive transactions before they hit the public mempool, which creates strong feedback loops that reinforce their dominance.
BuilderNet: A Response to Centralization
In late 2024, Flashbots introduced BuilderNet to tackle these centralization risks. BuilderNet, the main inspiration for the BAM architecture, allows multiple parties to operate a shared builder, offering equal access to orderflow at the network level. MEV proceeds are then distributed to orderflow providers based on open-source refund logic.
Participation is permissionless for both builders and orderflow providers. The broader goal is to prevent any single party from dominating block building.
Today, BuilderNet is jointly operated by Flashbots, Beaverbuild, and Nethermind and plans to expand. Within eight months, BuilderNet captured 30% of the market. Beaverbuild has largely transitioned its infrastructure over, and plans a full migration.
While promising, BuilderNet's long-term effectiveness remains uncertain. As long as individual builders can offer better orderflow deals to wallets, market makers, searchers or exchanges, centralization incentives will not disappear.
Implications of PBS for validators
PBS in Solana will introduce several economic shifts, but also some trade-offs, especially for validators:
Decreased MEV share for validators and delegators: With a new player in the block-building pipeline, rewards must be split. As seen on Ethereum, this can reduce delegator rewards and validator income.
However, more efficient block building, the new economics surrounding plugins, and a healthier MEV market will likely increase total network revenue, increasing the net proceeds for stakers and validators.
Source: Blockworks Research
Elimination of client-level optimizations
Today, validators can modify the client code to optimize transaction ordering on the scheduler level. This encourages competition among the validators, where those with better optimizations can earn more rewards, which may lead to having more stake. With block building outsourced, that opportunity disappears. Validators will no longer have control over client-side performance improvements. Instead, their role becomes more uniform: sign and propose blocks.
While these are important points, the upside for the broader ecosystem is real: PBS improves network efficiency and user experience by enabling more competitive, higher-value block construction.
PBS seems inevitable as networks reach sufficient activity and ecosystem maturity. The incentives to fix block building inefficiency become strong enough that a market participant will always rise to fix it. PBS reflects this evolution: a step toward optimized infrastructure that benefits the network and its users. We should all be happy that Solan has reached this point.
Limiting Toxic MEV
Beyond economics, one of BAM's key goals is reducing toxic MEV. Solana’s new design includes two security mechanisms to help achieve this:
Encrypted mempool: Transactions are encrypted when they enter BAM nodes ****and decrypted inside the TEE at the execution stage.
Ordering attestation: ****Each BAM transaction bundle includes a cryptographic record of the intended order. Validators are accountable for executing the transactions as proposed, or risk penalties.
These safeguards raise the bar for MEV attacks significantly. That said, risks remain:
Leaky transaction pipeline: since transactions are not encrypted at the client level, RPC nodes will still have the opportunity to leak the orderflow.
TEE vulnerabilities at the hardware or software level could expose encrypted transactions. If attackers can decrypt transactions sent to the BAM node, they could exploit the existing searching infrastructure for sandwiching attacks.
With their access to transaction information, malicious plugins could exploit transaction data unless plugin deployment is permissioned.
Validator dishonesty: executing transactions in a different order than proposed remains possible. Having verifiable attestations is not enough. There must be a credible enforcement (e.g., slashing or temporary lockouts).
While MEV will always be a game of cat and mouse, BAM makes harmful extraction meaningfully harder. While this benefits all users, it is especially important for attracting institutions that demand deterministic execution, privacy, and auditability. By enabling these features, BAM can drive higher activity and volume on Solana, ultimately increasing total network REV.
Infrastructure and Adoption Risks
Solana will likely face some of the same hurdles Ethereum encountered in its PBS transition:
Bootstraping TEEs
BAM nodes must run within TEEs, which will take time to roll out, especially as the network moves toward permissionless participation. Moreover, once the BAM code is open-sourced, mirrored block builder systems that operate outside enclaves could emerge.
Keeping blockbuilding decentralized
Once the framework is firmly established, TEEs will reduce the likelihood of BAM nodes privately selling order flow. However, keeping the process decentralized over time is no small task. Centralization pressures may persist, particularly if block builders invest heavily in attracting top searchers and developers to optimize block construction and dominate the market.
Conclusions
Solana is entering a new phase, defined not just by faster Alpenglow consensus, but by a fundamental rethinking of how blocks are built, ordered, and validated.
With the introduction of BAM, Solana is embracing Proposer-Builder Separation, TEE-based privacy protections, and programmable transaction pipelines through Plugins. These structural upgrades shift how value is created and flows through the network.
Yes, there are trade-offs. Validators may lose some of the flexibility and MEV opportunities they enjoy today. Client-level optimizations will become less relevant. Decentralization risks around block building will also be an issue. But these changes come with big upsides:
A fairer MEV environment, where toxic extraction is harder and incentives are better aligned.
Greater innovation potential through Plugins, allowing developers to build application-specific logic into the block-building process.
Stronger appeal to institutions, primarily due to the new MEV safeguards and enhanced privacy.
The transition won’t be easy. TEEs must be widely adopted, and builders and validators must adjust to new roles.
At Chorus One, we support upgrades that make Solana more efficient, resilient, and user-friendly. BAM brings these benefits. We’re excited to help build and support the next phase of Solana’s growth!
Alpenglow’s higher fault tolerance (40% vs 33%) comes at a modest and bounded cost when compared with Solana PoH.
A higher number of epochs increases the effects of compounding rewards up to the dominance of disinflation.
The possibility to decrease slot time can lead to
a ~38% reduction in MEV rewards from arbitrage
a ~24% reduction in MEV rewards from sandwiches
Lower grace period and reduced revenues from MEV may eventually push for geographical concentration of stake.
Shreds propagation design from relay may introduce disparities between validators, imposing a latency tax on small stake.
The choice for the overprovisioning of shreds (indirectly number or relays and shreds needed to reconstruct a slice), as presented in the original paper, still brings high block failure. Varying this parameters may have effects on network bandwidth.
The current design for message propagation is prone to Authenticate DDoS attacks.
PoH removal can potentially lead to a higher share of failed transactions landing on-chain.
The reward mechanism requires careful design, as it can be easily gamed if not properly constrained.
Alpenglow introduces randomness in rewards accrued per epoch. A careful design is required in order to avoid asymmetry between different stake shares.
1. Introduction
Solana remains one of the fastest and most adopted blockchains in the crypto ecosystem. In this context, we view Alpenglow as a bold and necessary evolution in the design of Solana’s consensus architecture.
Our position is fundamentally in favour of this shift. We believe that Alpenglow introduces structural changes that are essential for unlocking Solana’s long-term potential. However, with such a radical departure from the current Proof-of-History (PoH) based system, a careful and transparent analysis of its implications is required.
This document is intended as a complement to existing reviews. Rather than offering summary of the Alpenglow consensus, well covered in resources like the Helius article, our aim is to provide a rigorous peer review and a focused analysis of its economic incentives and potential trade-offs. Our goal is to provide a critical perspective that informs both implementation decisions and future protocol research.
The article is structured as follows. In Sec. 2 we go straight into the Alpenglow whitepaper to provide a peer review. Precisely, in Sec. 2.1 we analyze the less than 20% Byzantine stake assumption. In Sec. 2.2 we explore the effects of epochs on rewards compounding. In Sec. 2.3 we assess the implication of reduced slot time on MEV. In both Sec. 2.4 and 2.5 we study some implications of propagation design as presented in the original paper. In Sec. 2.6 we explore the possibility to perform Authenticated DDoS attack on the network. In Sec. 2.7 we assess some network assumptions and systemic limitations. Finally, in Sec. 2.8 we discuss some implications of PoH removal.
In Sec. 3 we explore some implications that arise from how tasks are rewarded under Alpenglow. Precisely, in Sec. 3.1, 3.2 and 3.3 we present three ways in which a sophisticated node operator can game the reward mechanisms. In Sec. 3.4 we assess the effects of randomness on rewards.
2. Protocol Review
In this section, we take a critical look at the Alpenglow consensus protocol, focusing on design assumptions, technical trade-offs, and open questions that arise from its current formulation. Our intent is to highlight specific areas where the protocol’s behaviour, performance, or incentives deserve further scrutiny.
Where relevant, we provide probabilistic estimates, suggest potential failure modes, and point out edge cases that may have meaningful consequences in practice. The goal is not to undermine the protocol, but to contribute to a deeper understanding of its robustness and economic viability.
2.1 - The 5f+1 fault tolerance
Alpenglow shifts from a 33% Byzantine tolerance to a 20% in order to allow for fast (1 round) finalization. While the 5f+1 fault tolerance bound theoretically allows the system to remain safe and live with up to 20% Byzantine stake, the assumption that Byzantine behaviour always takes the form of coordinated, malicious attacks is often too narrow. In practice, especially in performance-driven ecosystems like Solana, the boundary between rational misbehaviour and Byzantine faults becomes blurred.
Validators on Solana compete intensely for performance, often at the expense of consensus stability. A prominent example is the use of mod backfilling. While not explicitly malicious, such practices deviate from the intended protocol behaviour and can introduce systemic risk.
This raises a key concern: a nontrivial fraction of stake, potentially exceeding 20%, can engage in behaviours that, from the protocol’s perspective, are indistinguishable from Byzantine faults. When performance optimization leads to instability, the classical fault threshold no longer guarantees safety or liveness in practice.
Alpenglow models this possibility by allowing an additional 20% of the stake to be offline. This raises the resistance to 40% of the stake, being more aligned with a real implementation of a dynamical and competitive distributed system.
An essential question arising from the 5f+1 fault-tolerance threshold in Alpenglow is whether the current inflation schedule adequately compensates for security. To address this, we use the same formalism developed in our SIMD-228 analysis.
The primary task is to determine under what conditions the overpayment statement holds for a 20% Byzantine + 20% crashed threshold. To assess if the current curve is prone to overpayment of security, we need to study the evolution of the parameters involved. This is not an easy task, and each model is prone to interpretation.
The model is meant to be a toy-model showing how the current curve can guarantee the security of the chain, overpaying for security based on different growth assumptions. The main idea is to assess security as the condition
where the profit is estimated assuming an attacker can drain the whole TVL. Precisely, since the cost to control the network is >60% of total stake S (Alpenglow is 20% Byzantine + 20% crash-resistant), we have that the cost to attack is 0.6 × S, and the profit is the TVL. In this way, the chain can be considered secure provided that
In our model, we consider the stake rate decreasing by 0.05 following the equivalent of Solana PoH 150 epochs, based on the observation done in the SIMD-228 analysis. We further consider a minimum stake rate of 0.33 (in order to compare with the SIMD-228 analysis), a slot time of 400ms, 18,000 slots per epoch, and we fix the TVL to be DeFi TVL. We also assume 0 SOL as burn rate since we will not have vote transactions anymore, and we don’t know how many transactions Solana will handle per slot under Alpenglow.
It is worth noting that, these parameters are based on empirical data and what is used as default in the Alpenglow withepaper (page 42, Table 9).
The first case we want to study is when TVL grows faster than SOL price. We assumed the following growth rates:
SOL price growth of 20% a year - in 10 years, this means 1 SOL ~ $866.84
TVL growth of 62% a year in the first 4 years and 10% growth in the following years - this means Solana DeFi will reach Ethereum TVL in 4 years
The dynamical evolution obtained as an outcome of these assumptions is depicted below.
With the assumed growth rate, the current inflation schedule is projected to maintain adequate security for slightly more than two years. Notably, this has no real difference when compared to the timeline derived from the same growth scenario applied to the current Solana PoH implementation.
It is worth reiterating that the toy model presented here is a simplified parametrization of reality. The goal is not to precisely determine whether the current inflation schedule leads to overpayment or underpayment for security. Rather, it serves to quantify the impact of lowering the takeover threshold from 66% to 60% of stake under Alpenglow.
This shift implies that an adversary must control a smaller fraction of the stake to compromise the system, thereby reducing the cost of an attack. As the model shows, even a 6 percentage point increase may appear substantial, but in a scenario with fast TVL growth, the system shows virtually no difference compared to the PoH consensus. This suggests that Alpenglow’s higher fault tolerance comes at a modest and bounded cost, at least under optimistic growth assumptions.
As in the PoH scenario, if we assume SOL’s price growth rate surpasses the growth rate of the network’s TVL, the current inflation schedule would lead to approximately ten years of overpayment for network security, cfr. SIMD-228: Market Based Emission Mechanism.
2.2 - Effects of Epochs on Inflation
Alpenglow and the current Solana PoH implementation differ in the frequency of reward compounding. While both mechanisms eventually use a similar inflation curve, they distribute and compound rewards at vastly different rates: a lower number of slots per epoch increases the number of epochs per year in Alpenglow, compared to Solana PoH.
This difference in epoch definition (and slot time) has a direct impact on the effective APY received by validators. Even when the nominal inflation rate is identical, more frequent compounding leads to higher APY, due to the exponential nature of compound interest.
Formally, for a given nominal rate r and compounding frequency n, the APY is given by:
With Alpenglow’s much higher n, this yields a strictly larger APY than PoH under equivalent conditions. In the limit as n -> ∞, the APY converges to e^r-1, the continuously compounded rate. Alpenglow therefore approximates this limit more closely, offering a higher geometric growth of rewards.
This behaviour is illustrated in the figure above, which compares the compounded returns achieved under both mechanisms across different stake rates. The difference is particularly noticeable over short to medium time horizons, where the higher compounding frequency in Alpenglow yields a tangible compounding advantage. However, as the projection horizon extends, e.g., over 10 years, the difference becomes increasingly marginal. This is due to two effects: first, the declining inflation rate reduces the base amount subject to compounding; second, the PoH system's less frequent compounding becomes less disadvantageous once inflation levels off. In long-term projections, the frequency of compounding is a second-order effect compared to the shape of the inflation curve and the total staking participation.
2.3 - Network Delay and MEV
A central design parameter in Alpenglow is the network delay bound Δ, which defines the maximum time within which shreds and votes are expected to propagate for the protocol to maintain liveness. In practice, Alpenglow reduces Δ to nearly half of Solana’s current grace period (~800 ms), aiming for faster finality and tighter synchronization.
It is worth mentioning that, Alpenglow will not directly lower the slot time, which will be kept fixed at 400ms. However, Alpenglow makes lower slot time more reliable, meaning that in the future slot time can be lowered.
2.3.1 - Effects on Arbitrage
In this section, we consider the impacts of reducing network delay on arbitrage opportunities. We know, from Milionis et al, that the probability of finding an arbitrage opportunity between 2 venues is given by
where λ is the Poisson rate of block generation (i.e. the inverse of mean block time, Δt = λ⁻¹, γ is the trading fee, and σ is the volatility of the market price’s geometric Brownian motion.
From the trade probability, it is clear that reducing block time from 400ms also reduces the probability of finding an arbitrage opportunity within a block. Precisely, if we assume a daily volatility of 5% (σₛₑcₒₙd ~ 0.02%) and a fee γ = 0.3% we get
which represents a ~38% reduction on the probability we find a profitable arb.
The reduction on arbitrage probability clearly affects final rewards. Precisely, Corollary 2 of Milionis et al provides a closed form for arbitrage profit normalized by pool value V(p) in the case of a CPMM,
Indeed, by taking the ratio between the arbitrage profits in the case of different block times, we get
This means that the revenue from the same arbitrage opportunity decreased by ~38.2%. The same result still holds if the DEX implements concentrated liquidity, we have a similar result that can be obtained using Theorem 3 of Milionis et al (Asymptotic Analysis), which leads to
where y*(p) = –L / (2√p) within the price range [pa, pb].
It is worth noting that the functional form is a consequence of the fact that liquidity is concentrated within a price range. If the market price or pool price exists in this range, arbitrage profits are capped, as trades can only adjust to p_a or p_b. This reduces the magnitude of arbitrage profits compared to CPMMs for large mispricing.
It follows that the arb difference is dependent just from Ptrade, that is
which is consistent with the CPMM result.
2.3.2 - Effects on Timing Games
A direct consequence of reducing the “grace period” to approximately 400 ms, combined with the associated effects on arbitrage profitability, is the emergence of timing games. Sophisticated node operators are incentivized to engage in latency-sensitive strategies that exploit their physical proximity to the cluster. In particular, by positioning infrastructure geographically close to the majority of validators, they can receive transactions earlier, selectively delay block propagation, and increase their exposure to profitable MEV opportunities.
This behaviour may lead to a feedback loop: as Δ shrinks, the value of low-latency positioning increases, pushing operators to concentrate geographically, thereby undermining the network’s decentralization. While such latency-driven optimization already occurs under PoH, Alpenglow’s smaller Δ significantly amplifies its economic and architectural consequences.
To assess the impact of block time on sandwich attack profitability in a blockchain, we derive the probability p(tau) of successfully executing a sandwich attack, where tau is the slot time (time between blocks).
A sandwich attack involves an attacker detecting a victim’s transaction that impacts an asset’s price, submitting a front-run transaction to buy before the victim’s trade, and a back-run transaction to sell afterward, exploiting the price movement.
Transactions arrive at the mempool as a Poisson process with a blockchain transaction rate of Λ = 1,000 TPS, yielding a per-block rate λ = Λ·τ. Blocks are produced every τ seconds. The victim’s transaction is one of these arrivals, and we consider its arrival time tᵥ within the interval [0, τ]. Conditional on at least one transaction occurring in [0, τ], the arrival time of the first transaction is uniformly distributed over [0, τ]. Indeed, the Poisson process’s arrival times, conditioned on N(τ) = k ≥ 1, result in k arrival times T₁, T₂, …, Tₖ, which are distributed as independent uniform random variables on [0, τ]. If the victim’s transaction is any one of these arrivals, chosen uniformly at random, its arrival time tᵥ is equivalent to a single uniform random variable on [0, τ], so tᵥ ~ Uniform[0, τ].
The attacker detects the victim’s transaction and prepares the attack with latency d, submitting front-run and back-run transactions at time tᵥ + d, where tᵥ is the victim’s arrival time. We focus on the single-block sandwich, where all transactions are included in the same block in the correct order, ensured by high priority fees or Jito tips.
For a successful single-block sandwich, the attacker must submit the front-run and back-run transactions at tᵥ + d, and all three transactions (front-run, victim, back-run) must be included in the block at τ. The submission condition is tᵥ + d ≤ τ.
Since tᵥ ~ Uniform[0, τ], the probability density function is f(tᵥ) = 1 / τ, and the probability of submitting in time is
If τ < d, then tᵥ + d > τ for all tᵥ ∈ [0, τ], making submission impossible, so P(tᵥ ≤ τ − d) = 0. The back-run is submitted at tᵥ + d + δ, where δ is the preparation time for the back-run. Assuming δ ≈ 0 (realistic for optimized MEV bots), both transactions are submitted at tᵥ + d, and the same condition applies. We assume the block has sufficient capacity to include all three transactions, and the attacker’s fees/tips ensure the correct ordering (front-run, victim, back-run) with probability 1. Thus, the probability of a successful sandwich is:
This linear form arises because the uniform distribution of tᵥ implies that the fraction of the slot interval where tᵥ ≤ τ − d scales linearly with τ − d. The profitability of a sandwich attack can be written as
where ε is the slippage set from the victim’s transaction, V is the victim’s volume, and F is the fee. To quantify the relative change when reducing block time from τ₄₀₀ = 0.4 s to τ₁₅₀ = 0.15 s, we can compute
since the profit per executed sandwich is independent of block time. If we assume d = 50 ms, we get
indicating that the profit with a slot time of 400 ms is 31.25% higher than the profit with a slot time of 150 ms (or equivalently, we have a 23.8% reduction in sandwich profits with Alpenglow).
Before ending the section, it is worth mentioning that, in real cases, sandwich attacks suffer from interference (e.g., from competitors). Precisely, on Solana, transactions are processed in a loop during the slot time. This means that, if the loop lasts for tₗₒₒₚ, there is a temporal window [tᵥ, tᵥ + tₗₒₒₚ] where interfering transactions can arrive. Since these transactions still arrive following a Poisson process, we know that the probability of no interference (i.e., no interfering transaction arrives in tₗₒₒₚ) is
where Λᵢₙₜ is the TPS for interfering transactions. This factor translates into a probability of a successful sandwich of the form
This is a term that depends on the time needed to process transactions in a loop, which in principle is independent of the block time. In case this tₗₒₒₚ is reduced when reducing slot time, sandwich profitability will always increase by going from 400 ms to 150 ms.
2.4 - Stake-Ordered Propagation and Its Implications
Alpenglow specifies that once a relay receives its assigned shred, it broadcasts its shred to all nodes that still need it, i.e., all nodes except for the leader and itself, in decreasing stake order (cfr. Alpenglow paper page 13). While this design choice appears to optimize latency toward finality, it introduces important asymmetries in how information is disseminated across the network.
From a protocol efficiency standpoint, prioritizing high-stake validators makes sense: these nodes are more likely to be selected as voters, and their early participation accelerates the construction of a supermajority certificate. The faster their votes are collected, the sooner the block can be finalized.
However, this propagation order comes at the expense of smaller validators, which are placed at the tail end of the dissemination process. As a result:
Small validators may receive shreds later, increasing the probability that by the time they vote, a certificate is already formed without their participation.
Given that voting is rewarded, these validators are effectively disadvantaged: they may miss out on reward opportunities not due to faults or downtime, but due to structural delays in propagation.
This introduces a self-reinforcing inequality: high-stake validators receive data earlier, vote earlier, and earn more rewards, thereby compounding their stake and influence over time.
In short, while stake-ordered propagation helps optimize time-to-finality, it imposes a latency tax on small validators, which may undermine long-term decentralization by suppressing their economic participation.
However, it is worth mentioning that, Turbine has more than one layer, meaning that most small stake may get the shreds with multiple network delays. In principle, with Rotor, this stake is only impacted by the transmission delay of the relay.
2.5 - Block Propagation and Slice Failure
Lemma 7 presents a probabilistic bound ensuring that a slice can be reconstructed with high probability, provided a sufficient number of honest relays. While the lemma is mathematically sound, its real-world implications under the chosen parameters raise several concerns.
In particular, the paper adopts a Reed–Solomon configuration with Γ = 64 total shreds and a decoding threshold γ = 32, meaning that any 32 out of 64 shreds are sufficient to reconstruct a slice. Each shred is relayed by a node sampled by stake, and blocks are composed of 64 slices. Finality (via Rotor) requires all slices to be reconstructed, making the system sensitive to even a single slice failure.
The authors justify slice reliability using a Chernoff bound, but for Γ = 64, this is a weak approximation: the Chernoff bound is asymptotic and performs poorly in small-sample regimes. Using an exact binomial model instead, we can estimate failure probabilities more realistically.
Assume 40% of relays are malicious and drop their shreds (pₕₒₙₑₛₜ = 0.6). The probability that fewer than 32 honest shreds are received in a single slice is:
or
This gives P(X < 32) = 0.06714, which represents the single slice failure probability. Since Rotor requires all 64 slices to succeed, the block success probability becomes:
from which the block failure probability is
This is a very high failure probability in the case of a 40% Byzantine stake.
The situation improves only if:
Γ increases (more shreds per slice), or
γ decreases (less redundancy required), or
The system is heavily over-provisioned.
For instance, with Γ = 265 and γ = 132, the slice failure rate under 40% Byzantine stake drops dramatically (though still around 3%), but this imposes higher network and computation costs.
The issue, then, is not the lemma itself, but the practicality of its parameters. While the theoretical bound holds as γ → ∞, in real systems with finite Γ, the choice of redundancy has significant implications:
Higher Γ increases resilience but adds bandwidth and decoding load.
Low Γ, as used in current Solana deployments (e.g., 32 shreds), severely limits robustness without over-provisioning.
2.6 - Message Handling and DDoS Risk
Alpenglow’s messaging system relies on small (<1,500 byte) UDP datagrams for vote transmission (Section 1.4, Page 6). These messages are authenticated using QUIC-UDP or traditional UDP with pairwise message authentication codes (MACs), derived from validator public keys. On receipt, validators apply selective storage rules—only the first notarization vote per block from a given validator is stored (Definition 12, Page 17), with all duplicates ignored.
While this mechanism limits the impact of duplicate votes on consensus itself, it does not eliminate their resource cost. In practice, nodes must still verify every message’s MAC and signature before deciding to store or discard it. This opens a subtle but important attack vector: authenticated DDoS.
A validator controlling less than 20% of the stake can send large volumes of valid-looking, authenticated votes, either well-formed duplicates or intentionally malformed packets. These messages will be processed up to the point of verification, consuming CPU, memory, and network bandwidth on recipient nodes. If enough honest nodes are affected, they may be delayed in submitting their own votes.
This has two possible consequences:
1. Triggering Skip Certificates:
If more than 60% of stake skip votes, even if the leader and most voters were honest. While Alpenglow preserves safety in such cases, liveness is degraded.
2. Selective performance degradation:
Malicious actors could preferentially target smaller or geographically isolated validators, increasing their latency and further marginalizing them from the consensus process.
It’s important to stress that the attack cost is minimal: only the minimum stake required to activate a validator is needed. Indeed, in Alpenglow, votes are not transactions anymore, and SOL does not have the goal of being a spam protection token. Once active, a malicious node with valid keys is authorized to send signed votes, and these must be processed by peers. Unlike traditional DDoS, where filtering unauthenticated traffic is trivial, here the system's correctness depends on accepting and validating messages from all honest-looking peers.
While Alpenglow does not rely on message ordering or delivery guarantees, it remains vulnerable to resource exhaustion via authenticated spam, especially under adversaries who do not need to compromise safety thresholds to cause localized or network-wide disruption.
2.7 - Latency, Processing, and the Stake–Bandwidth
Several aspects of Alpenglow’s evaluation rest on assumptions about network behaviour and validator operations that, while simplifying analysis, may obscure practical challenges in deployment.
2.7.1 - Simplified Latency Assumptions
The simulations in the paper assume a constant network latency, omitting two critical factors that affect real-world performance:
Latency variability: network delays are not constant but fluctuate due to congestion, routing instability, and geographic distance.
Packet loss: especially for UDP-based protocols, loss is non-negligible and may be bursty or asymmetric. This can lead to unreliable shred or vote propagation, particularly under adverse conditions or targeted load.
These effects can meaningfully impact both block propagation and vote arrival times, and should be explicitly modelled in simulations.
2.7.2 - Packet Transmission vs. Processing Delay
Another element that requires a deep dive is the distinction between message reception and message processing. While validators may receive a shred or vote in time, processing it (e.g., decoding, MAC verification, inclusion in the vote pool) introduces a non-trivial delay, especially under high network load.
The absence of empirical measurements for this processing latency, especially under saturated or adversarial conditions, may limit the trustworthiness of the estimated time-to-finality guarantees.
2.7.3 - Stake Does Not Equal Bandwidth
Finally, Section 3.6 (Page 42) assumes that stake is a proxy for bandwidth, that is, validators with more stake are expected to provide proportionally more relay capacity. However, this assumption can be gamed. A single operator could split its stake across multiple physical nodes, gaining a larger share of relaying responsibilities without increasing aggregate bandwidth. This decouples stake from actual network contribution, and may allow adversarial stake holders to degrade performance or increase centralization pressure without being penalized.
2.8 - Implications of PoH Removal
One consequence of removing PoH from the consensus layer is the loss of a built-in mechanism for timestamping transactions. In Solana’s current architecture, PoH provides a cryptographic ordering that allows validators to infer the age of a transaction and deprioritize stale ones. This helps filter transactions likely to fail due to state changes (e.g., nonces, account balances) without incurring full execution cost.
Without PoH, validators must treat all transactions as potentially viable, even if many are clearly outdated or already invalid. This increases the computational burden during block execution, as more cycles are spent on transactions that ultimately revert.
Current on-chain data show that failed bot transactions account for ~40% of all compute units (CUs) used, but only ~7% of total fees paid. In other words, a disproportionate share of system capacity is already consumed by spammy or failing transactions, and removing PoH risks further exacerbating this imbalance by removing the only embedded mechanism for temporal filtering.
While PoH removal simplifies protocol architecture and decouples consensus from timekeeping, it may unintentionally degrade execution efficiency unless new mechanisms are introduced to compensate for the loss of chronological ordering.
3 - Economic Impact and Game Theory
The Alpenglow whitepaper doesn’t provide a full description of how rewards are partitioned among different tasks fulfilled by validators. However, there are features that are less dependent on actual implementation. With this in mind, this section is focussed on describing some properties may arise from the rewarding system.
3.1 - Self reporting of tasks
As described in the paper, during an epoch e, each node counts how many messages (weighted messages, or even bytes) it has sent to every other node and received from every other node. So every node accumulates two vectors with n integer values each. The nodes then report these two vectors to the blockchain during the first half of the next epoch e + 1, and based on these reports, the rewards are being paid. This mechanism mostly applies to Rotor and Repair, since voting can be checked from the signatures in the certificate.
For Repair, while the design includes some cross-validation, since a validator vᵢ sends and receives repair shreds and reports data for other validators vⱼ ≠ vᵢ, there is still room for strategic behaviour. In particular, since packet loss is inherent to UDP-based communication, underreporting repair messages received from other validators cannot easily be flagged as dishonest. As a result, nodes are not properly incentivized to provide accurate reporting of messages received, creating a gap in accountability.
The situation is more pronounced for Rotor rewards, which are entirely based on self-reporting. When a validator vᵢ is selected as a relay, it is responsible for disseminating a shred to all validators (except itself and the leader). However, because there is no enforced acknowledgment mechanism, rewards cannot depend on whether these shreds are actually received by every node, only on whether the slice was successfully reconstructed. In this framework, a rational relay is incentivized to minimize dissemination costs by sending shreds only to a subset of high-stake validators, sufficient to ensure that γ shreds are available for decoding. This strategy reduces bandwidth and CPU usage while preserving the probability of slice success, effectively allowing relays to free-ride while still claiming full credit in their self-reports.
3.2 - No stake, no bandwidth
As discussed in Sec. 2.7.3, a node operator can reduce hardware costs by splitting the stake across multiple identities, exploiting the fact that expected bandwidth delivery obligations are proportional to stake. This allows the operator to distribute the load more flexibly while maintaining aggregate influence.
Alpenglow paper, in Sec. 3.6, introduces a mechanism that penalizes validators with poor performance. Precisely, the selection weight of these validators is gradually reduced, diminishing their likelihood of being chosen to do tasks in future epochs. While this mechanism intends to enforce accountability, it also creates a new incentive to underreport. Since selection probability affects expected rewards, validators now have a strategic reason to downplay the observed performance of peers.
In this context, underreporting becomes a rational deviation: by selectively deflating the recorded bandwidth contribution of others, a validator can increase the relative selection weight of its own stake. This dynamic may further erode the trust assumption behind self- and peer reporting, and eventually amplify the economic asymmetry between high- and low-resource participants.
3.3 - Strategic Vote Withholding
Although Alpenglow removes explicit vote transactions, its reward mechanism still admits a form of time-variability compensation gameability. Specifically, there exists a potential vulnerability in which a validator can strategically delay its vote to maximize the likelihood of earning the special reward for broadcasting the first Fast-Finalization Certificate (FFC).
To incentivize timely participation, Alpenglow rewards validators for voting and relaying data, with additional bonuses for being the first to submit certificates. This mechanism, while well-intentioned, opens the door to timing-based exploitation.
Consider a validator v controlling X% of the total stake, where X is large enough to push cumulative notarization votes past the 80% threshold. During the first round of voting for a block b in slot s, validator v monitors the notarization votes received in its Pool. The strategy works as follows:
Vote Withholding: Validator v refrains from casting its NotarVote until it observes that the cumulative stake of received votes exceeds (80 − X)% but remains just under 80%. This ensures the FFC has not yet been triggered.
Timed Vote Submission: We are at time t = t₀ + δₑₛₜ + ε, where t₀ is the slot start time, δₑₛₜ is the estimated network propagation delay for 80% of the stake, and ε is a small buffer. The validator v submits a NotarVote. To cover fallback finalization, v may also submit a NotarFallback vote.
Fast-Finalization Certificate Issuance: Upon submitting its vote, the total voting weight reaches or exceeds 80% (by construction). Validator v immediately generates an FFC and broadcasts it. By exploiting a low-latency network position, v increases the likelihood that its certificate is the first observed, thereby capturing the special reward.
Fallback to Slow Path (if needed): If v’s FFC is not the one finalized, then its original NotarVote still contributes to the slow path. This yields a standard voting reward, though the special bonus is forfeited.
This strategy has asymmetric risk: the validator either receives the normal reward (if it fails) or both the normal and special reward (if it succeeds), with no penalty for delayed voting. As such, validators with low-latency infrastructure and accurate network estimation have an economic incentive to engage in this behaviour, reinforcing centralization tendencies and undermining the fairness of the reward distribution.
3.4 - Impact of Randomness on Rewards
In this section, we examine how inherent randomness in task assignment affects validator rewards. Even if a validator fulfils every duty it’s assigned (voting, relaying, repairing), the Alpenglow protocol still injects non-determinism into its reward streams. Voting remains predictable, since every validator casts a vote each slot, but relay income depends on the stochastic selection of one of Γ relays per slot, and repair income depends both on being chosen to repair and on the random need for repairs. We use a Monte Carlo framework to isolate and quantify how much variance in annual yield arises purely from these random sampling effects.
In our first simulation suite, we fix a validator’s stake share and vary only the split between voting and relay rewards, omitting repair rewards for now to isolate their effects later. Concretely, we let
for each (f_relay, f_vote) pair, and for each epoch in the simulated year, we:
Compute the issuance: Determine the epoch’s inflation payout from a 4.6% annual rate, decaying 15% per year down to a 1.5% floor.
Set per-task rewards: We compute the reward per vote and the reward per relay task.
Sample relay assignments: Draw the number of times our validator is selected as one of Γ = 64 relays in each epoch’s 18,000 slots.
Accumulate rewards: We compute the rewards accrued.
Compound over epochs: Roll rewards into stake each epoch to compute the year-end APY.
First simulations assume a stake share of 0.2% and a network-wide stake rate of 65%. This framework lets us see how different reward splits affect the dispersion of APY when relay selection is the sole source of randomness.
The plot above shows the Probability Density Function (PDF) of APY obtained by varying the Relay rewards share. We can see that up to a 50% split, the variance is not dominating the rewards, where the APY is approximately 6.75% from the 5th percentile (p05) to the 95th percentile (p95).
If we reduce the stake share to 0.02% (with current stake distribution, this corresponds to the 480th position in validator rank - 93.5% cumulative stake) we see that 50% share has some variability that may affects rewards. In this scenario, APY varies from 6.74% for p05 to 6.75% for p95. Even though a 0.01 percentage-point spread seems negligible, over time and combined with other asymmetries, it can create meaningful divergence in rewards.
Accordingly, we adopt a 20% relay‐reward share for all subsequent simulations. Indeed, we can see that, by fixing the relay‐reward share at 20%, the spread in APY distribution is mostly negligible moving from 0.02% stake share to 2%.
With repair rewards added, we now set
We also assume that 5% of slots on average require a repair fetch.
Running the same Monte Carlo simulations under these parameters reveals two key effects:
Increased asymmetry for low-stake validators: Unlike voting (deterministic) and relaying (high-frequency sampling), repair rewards are both infrequent (only 5% probability a slot is not in Blockstore) and random in assignment. A small validator may be selected for very few repair tasks, or none at all, over the course of a year. As a result, their share of the 5% repair-reward pot can vary wildly, even if their stake share remains constant.
Wider APY dispersion: When we plot APY versus stake share, the repair component introduces a pronounced “tail” in the distribution for lower-stake nodes. Whereas previously the 5th–95th percentile band was on the order of 0.01 pp for small stakes, adding repair rewards can expand that spread by 0.04 pp, enough to materially affect ROI comparisons and reinforce centralization pressures.


.png)
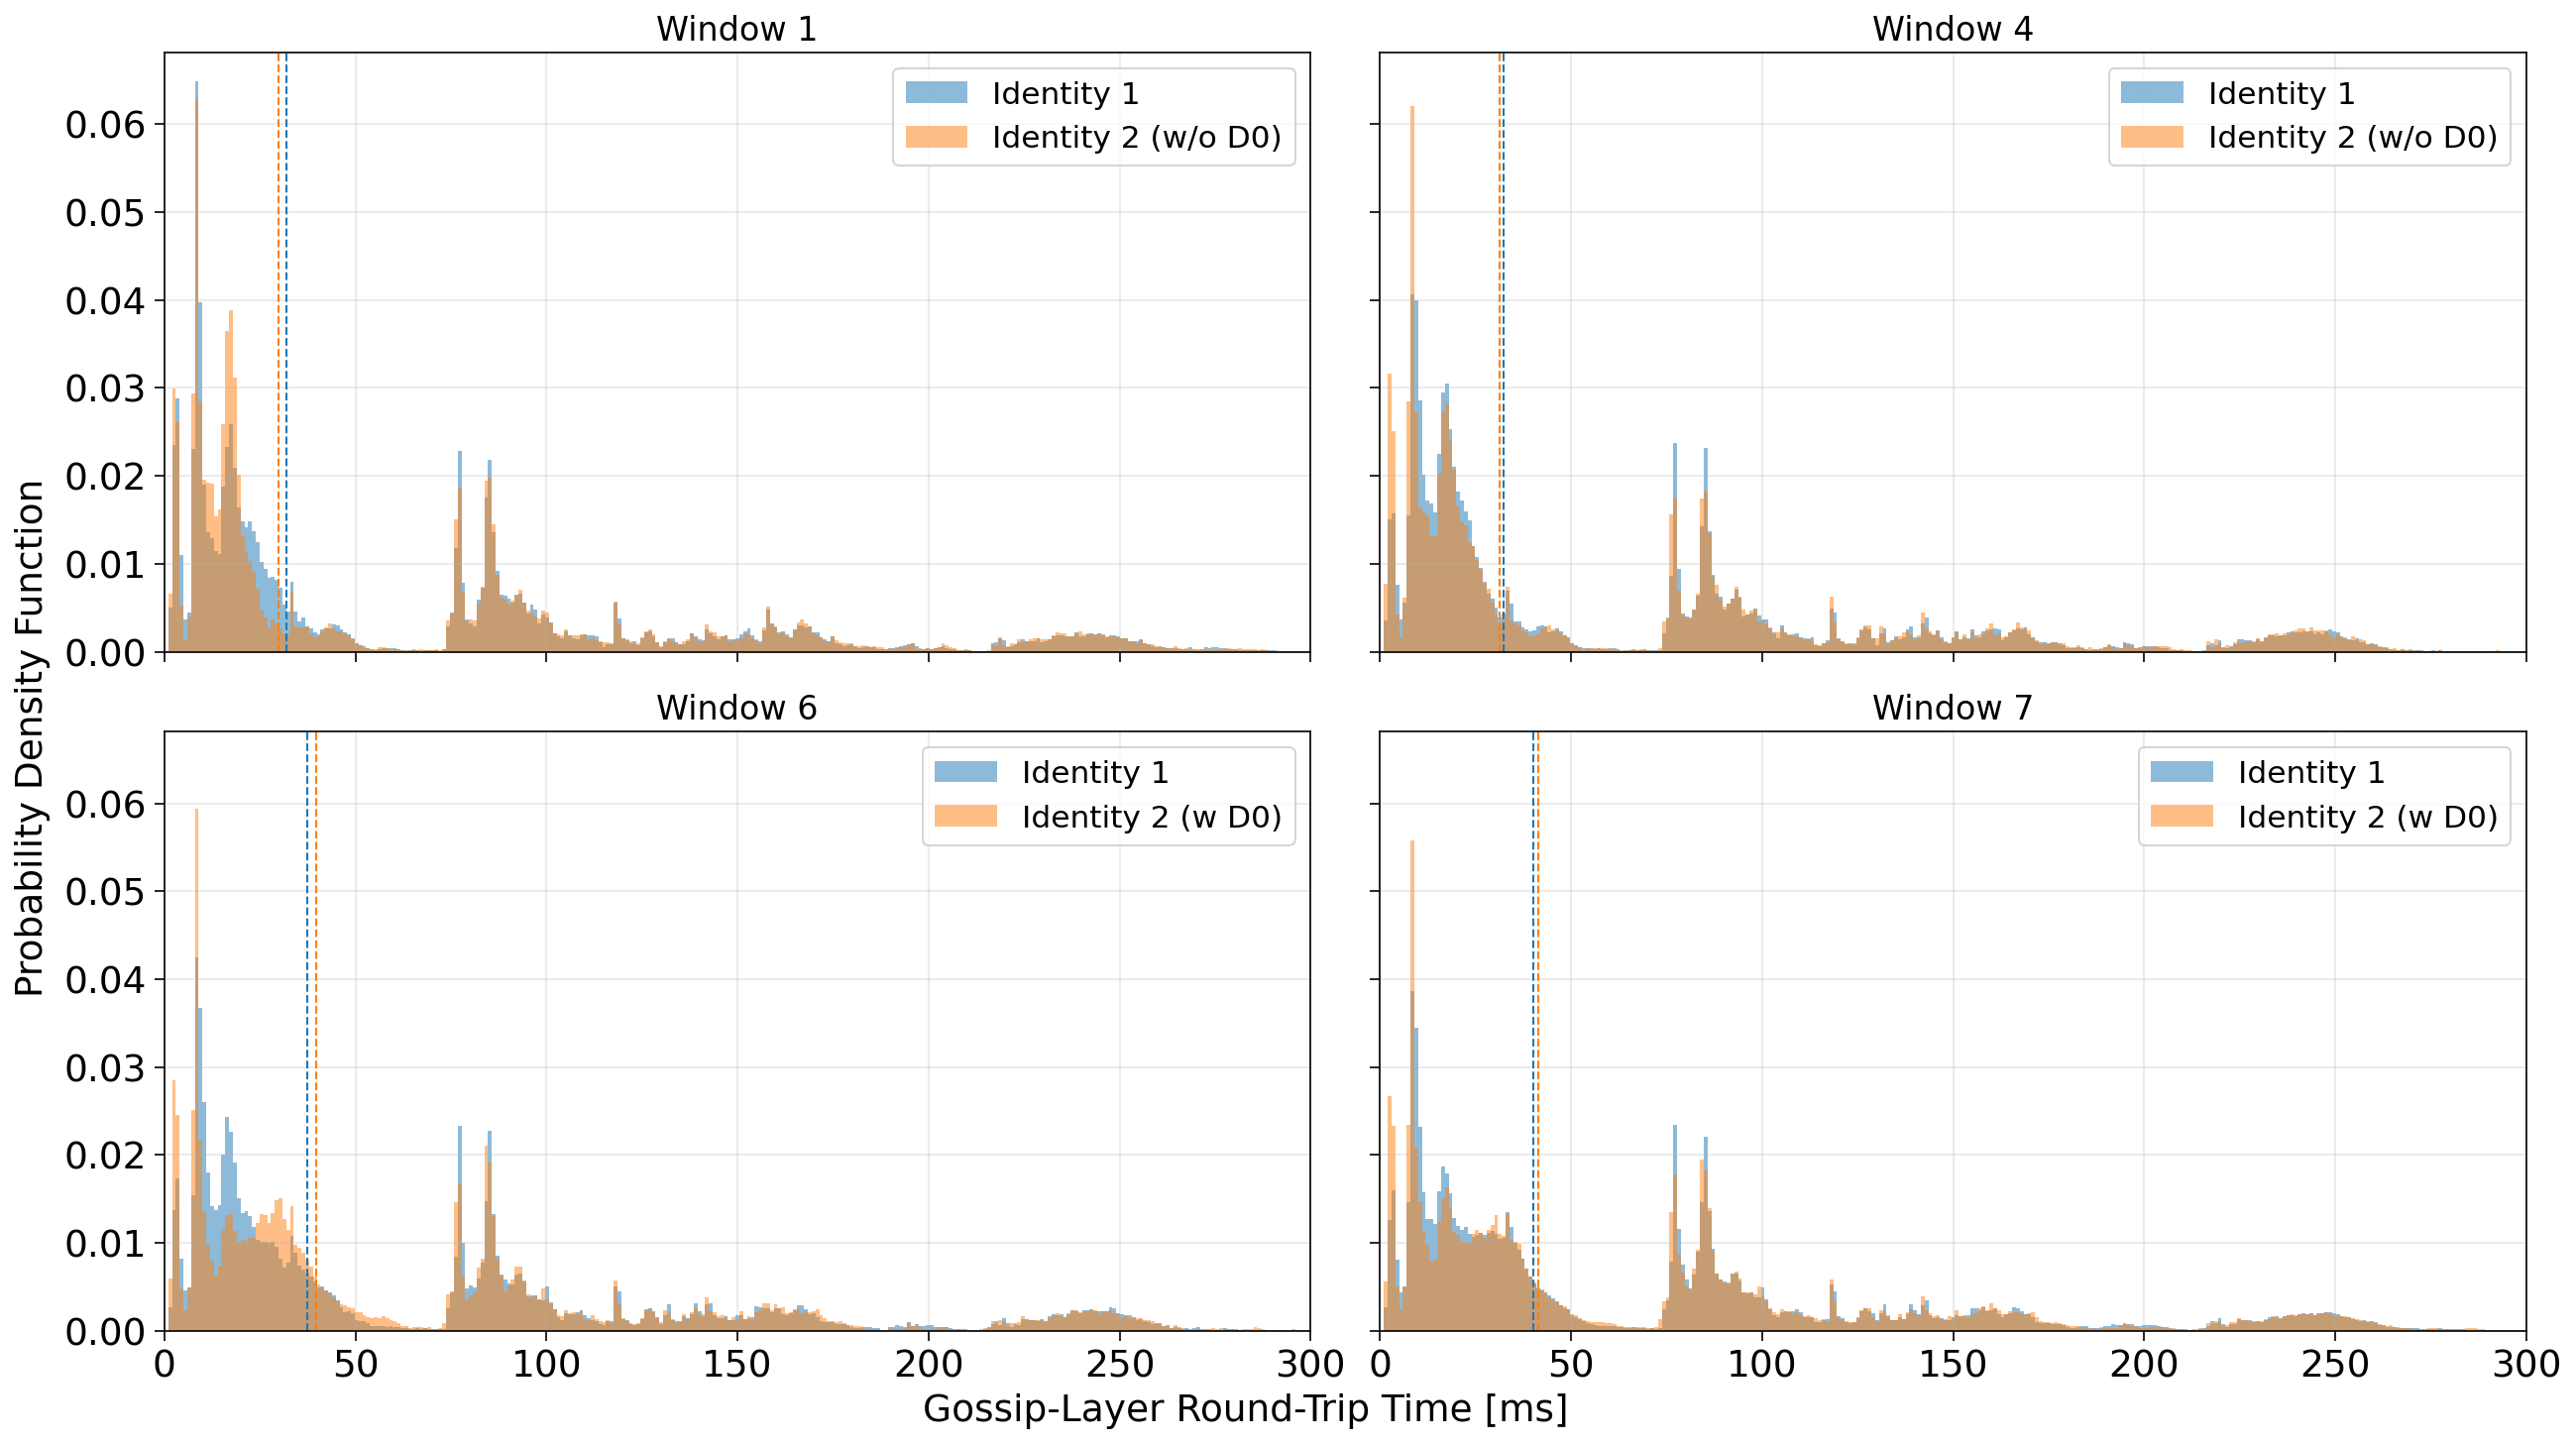

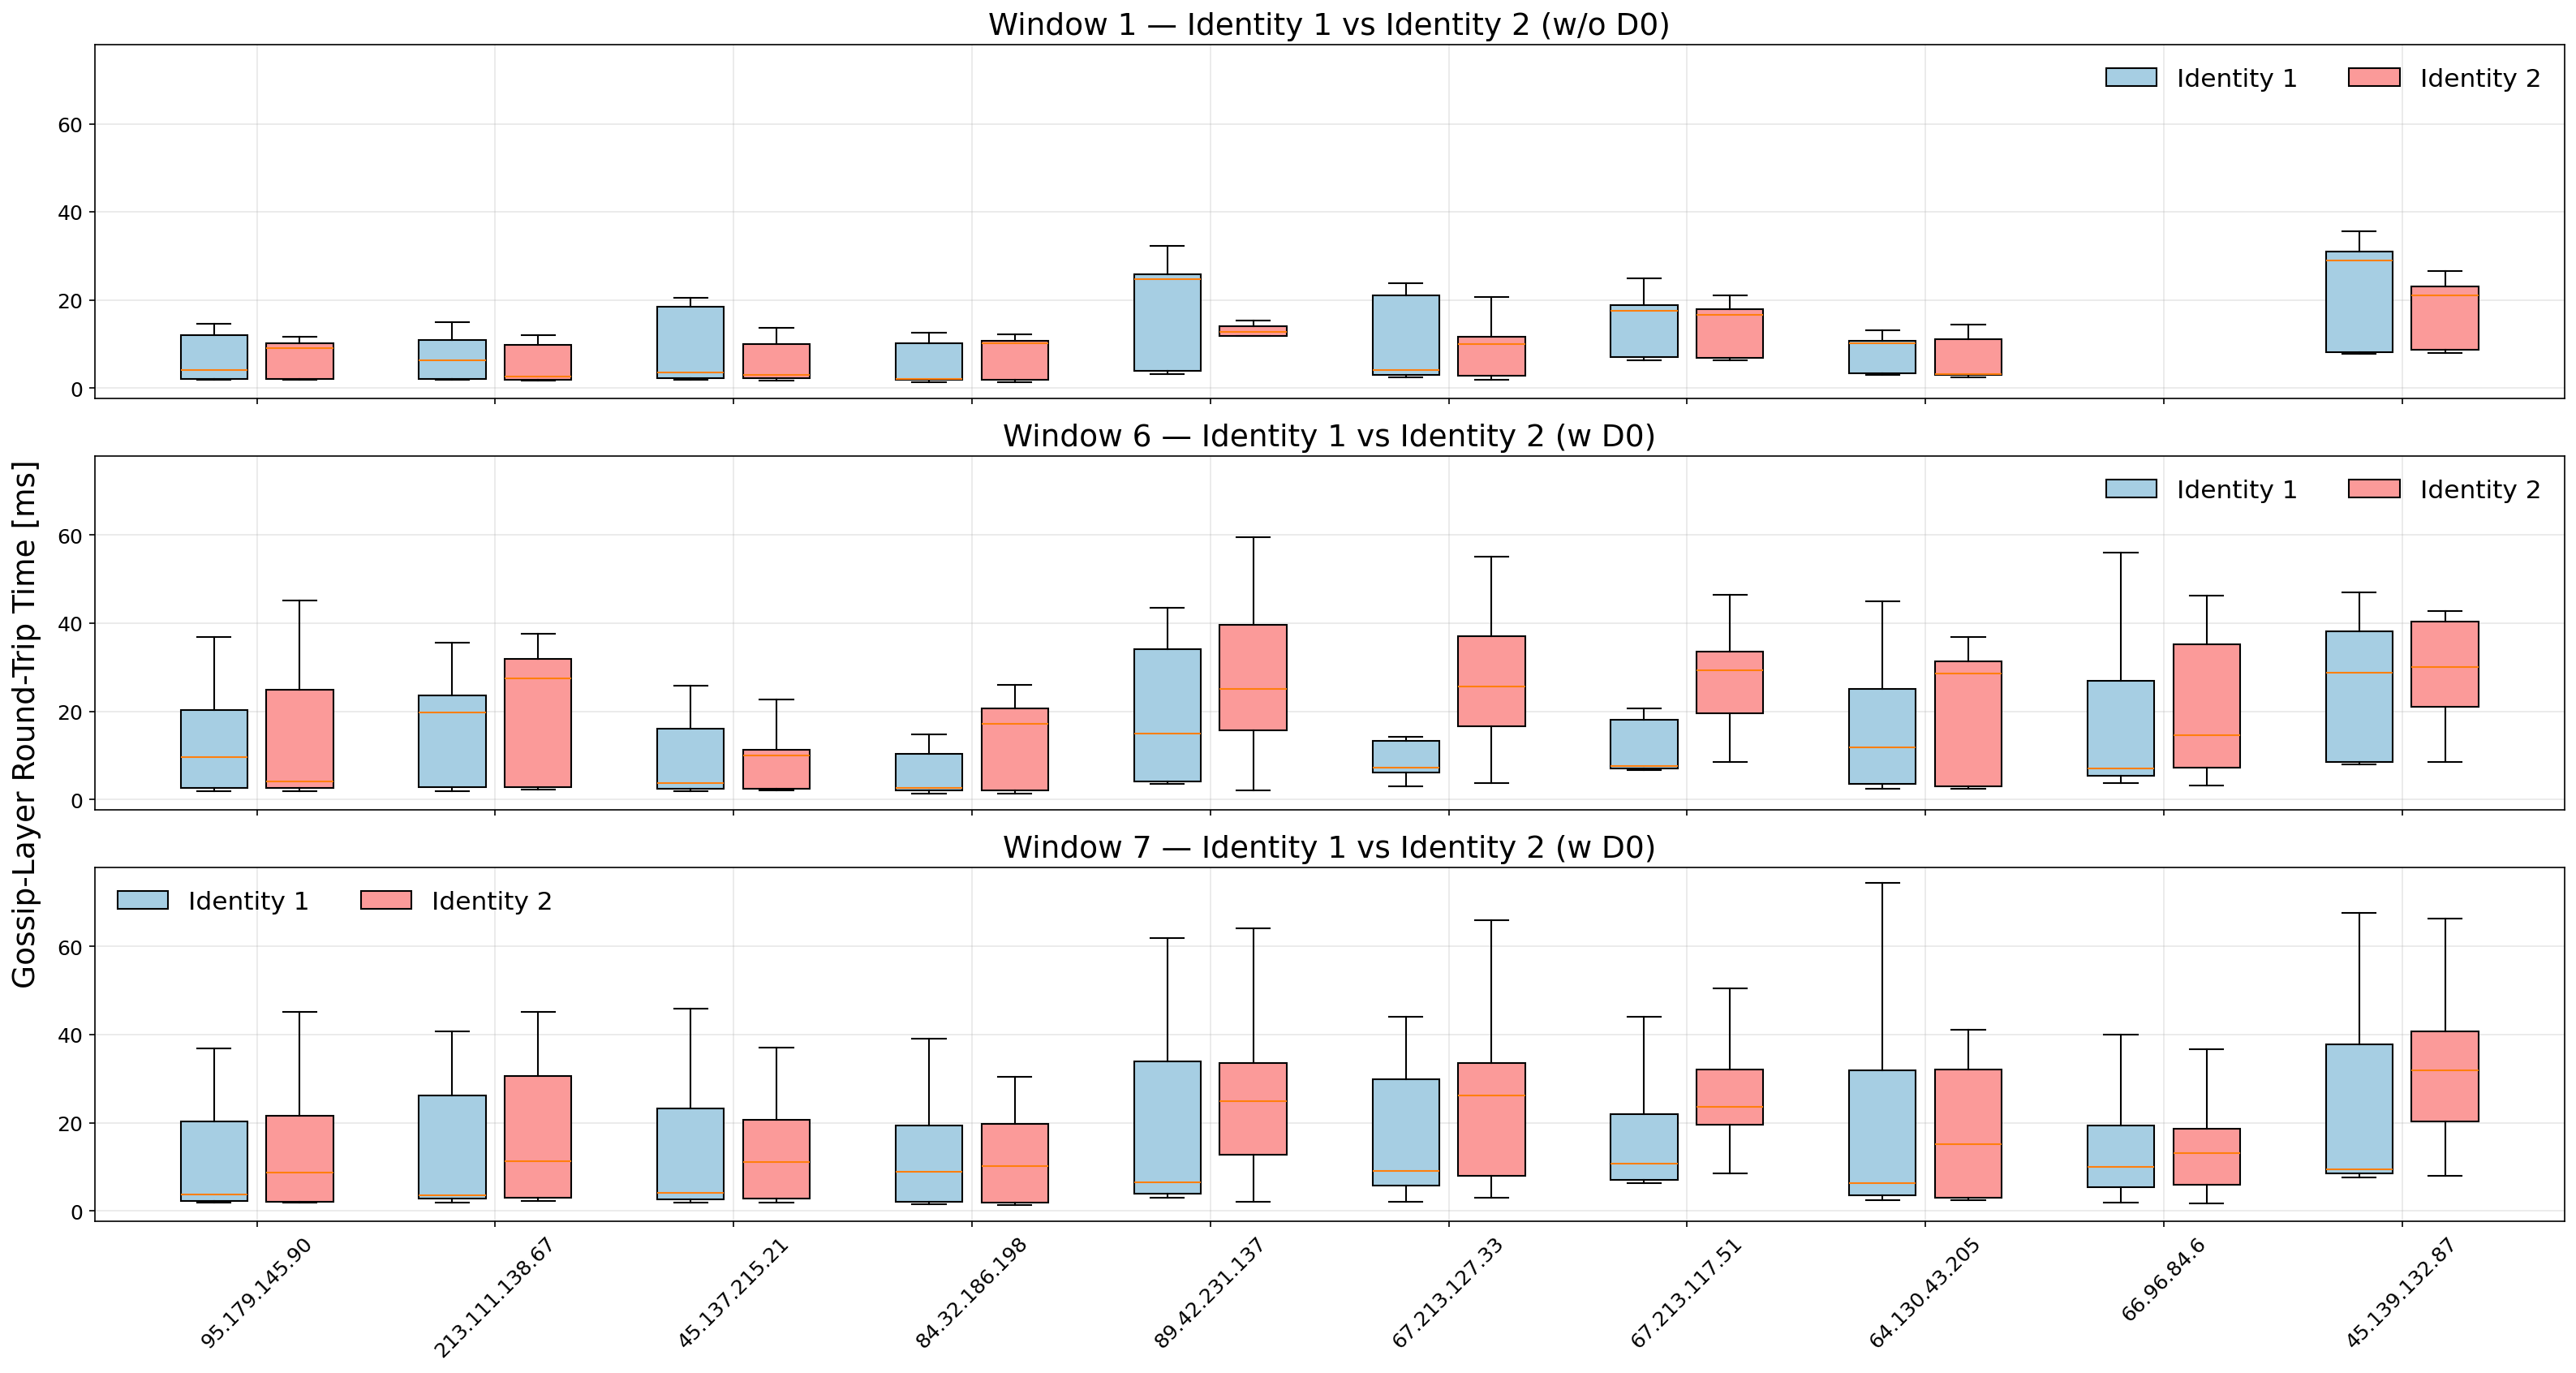


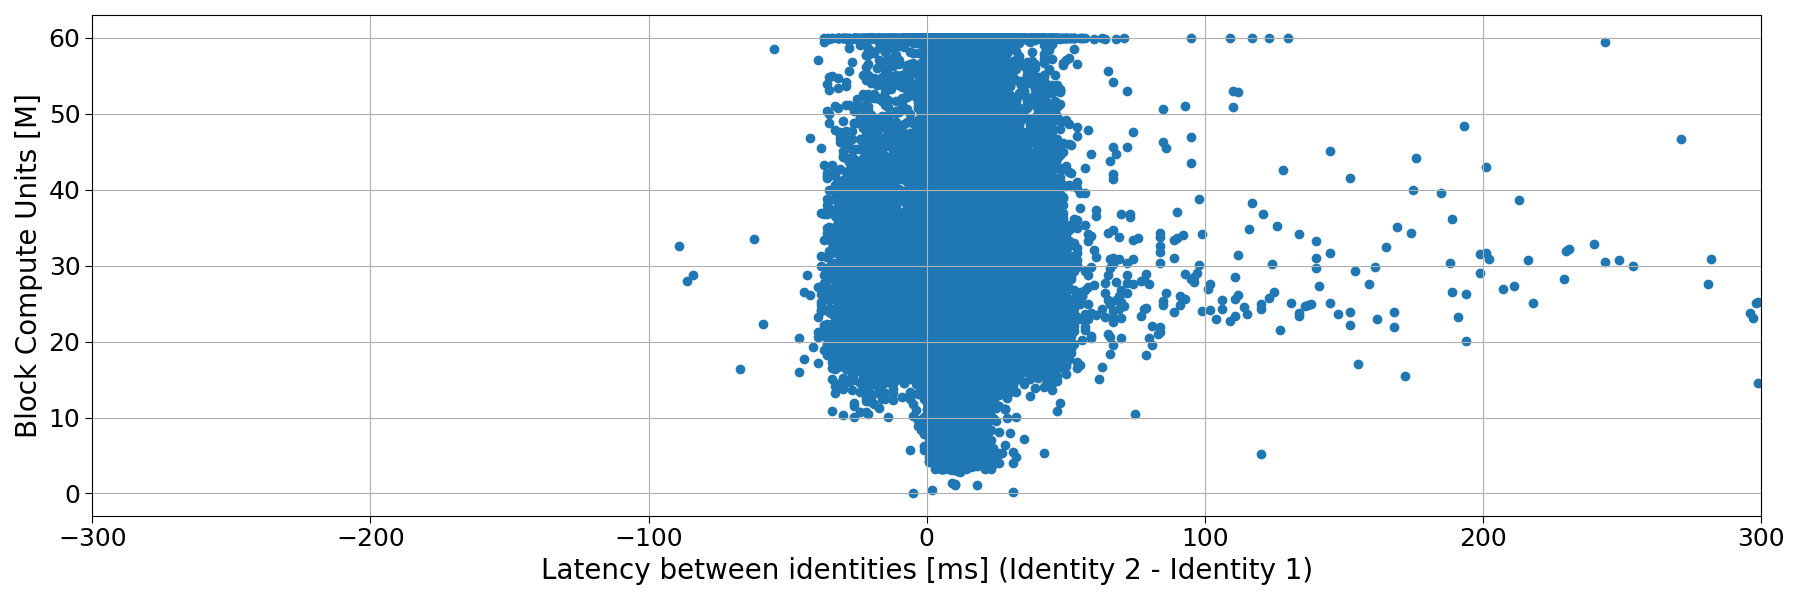
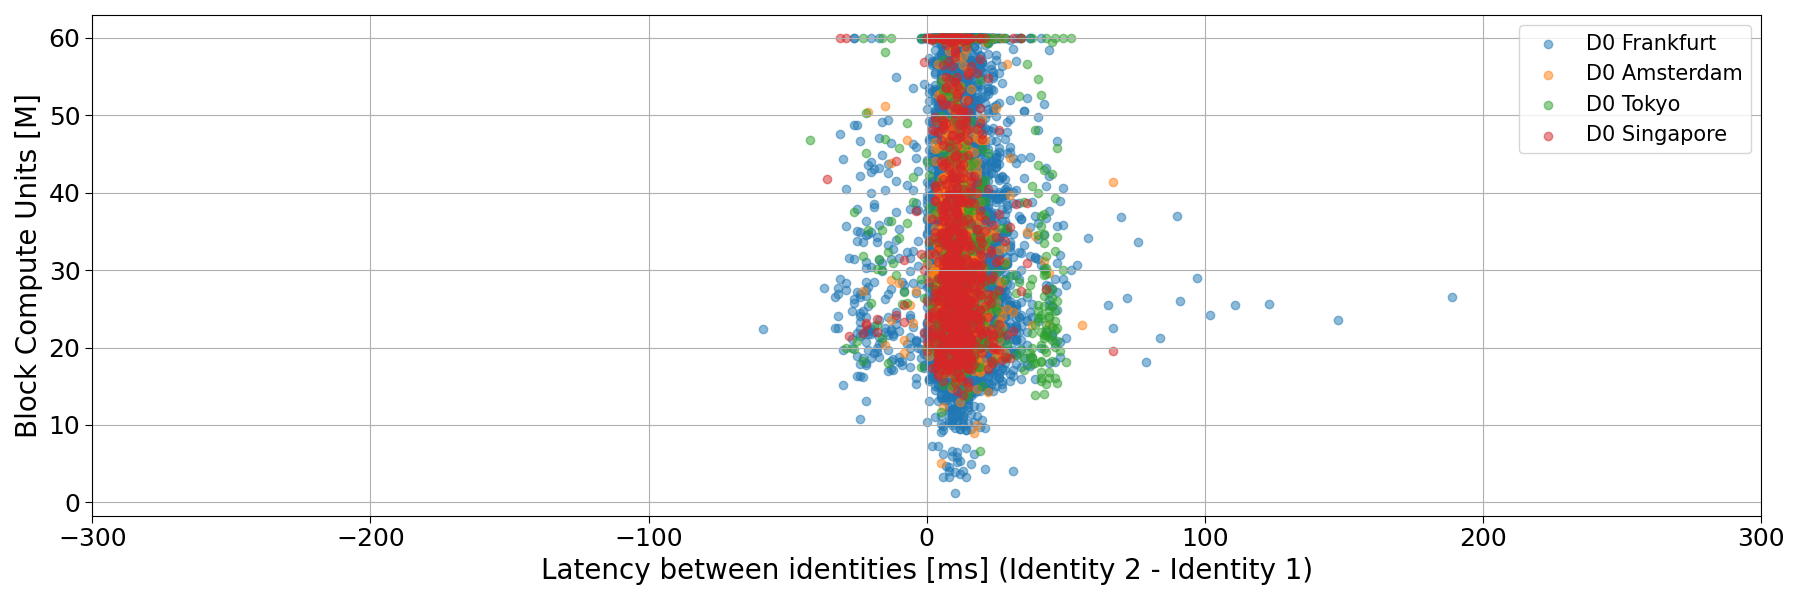

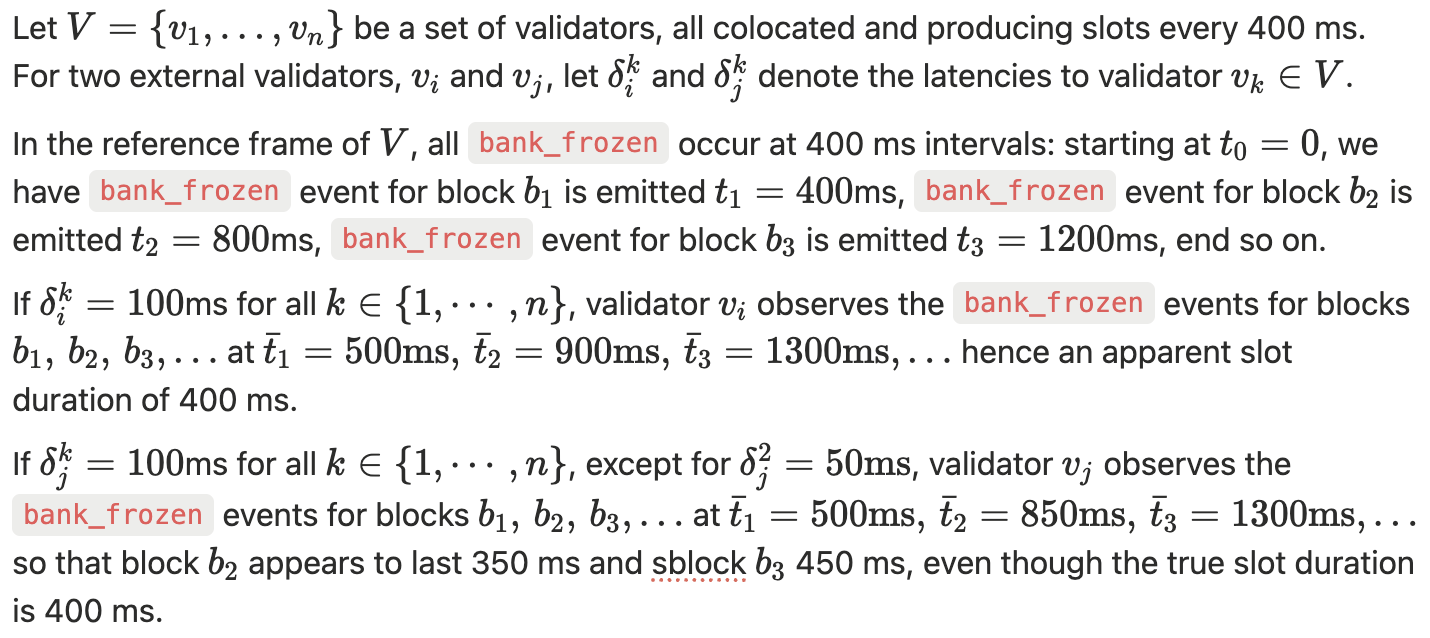

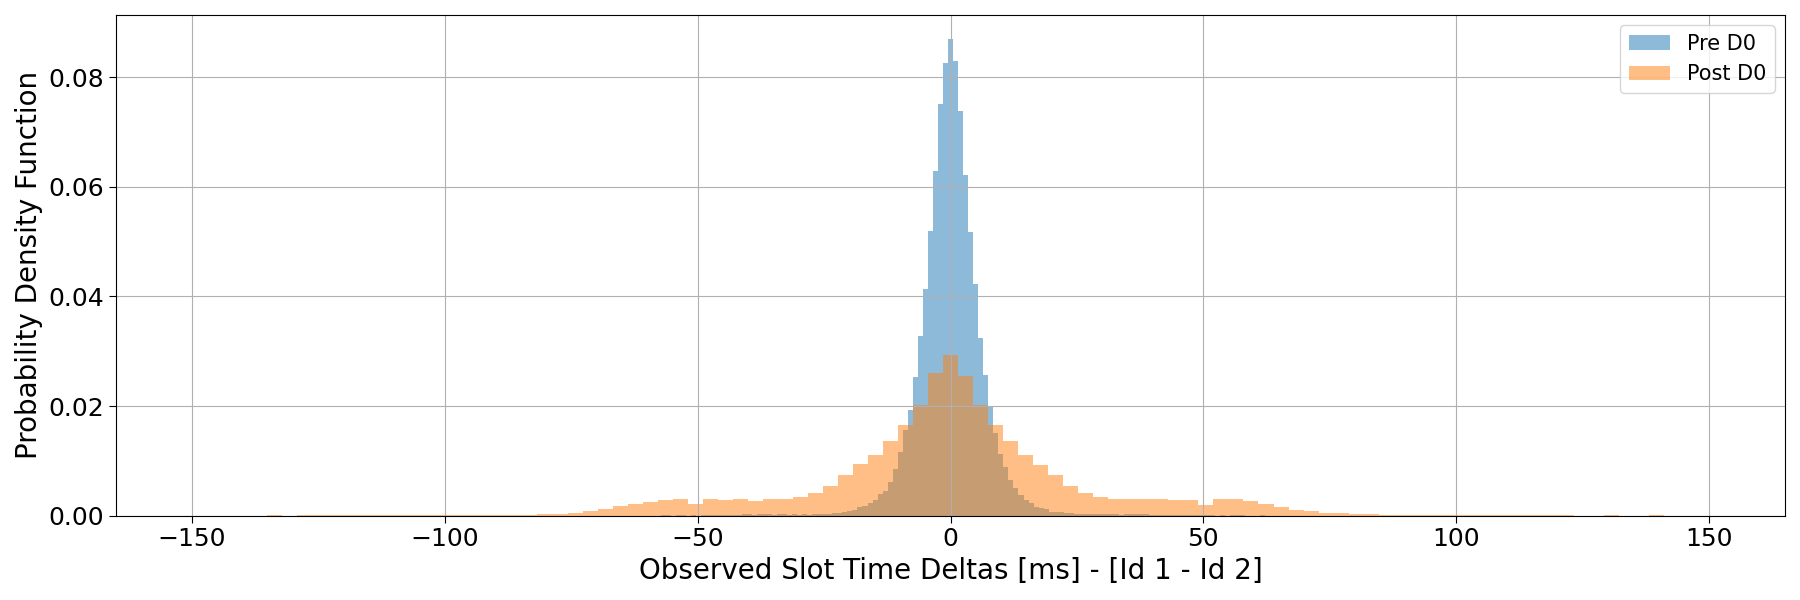


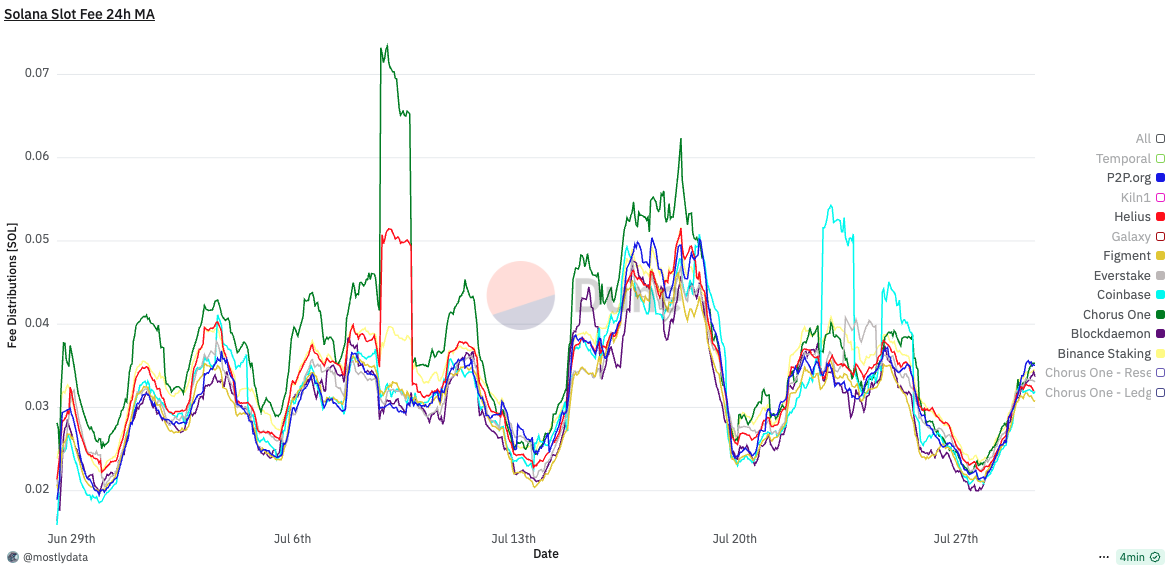
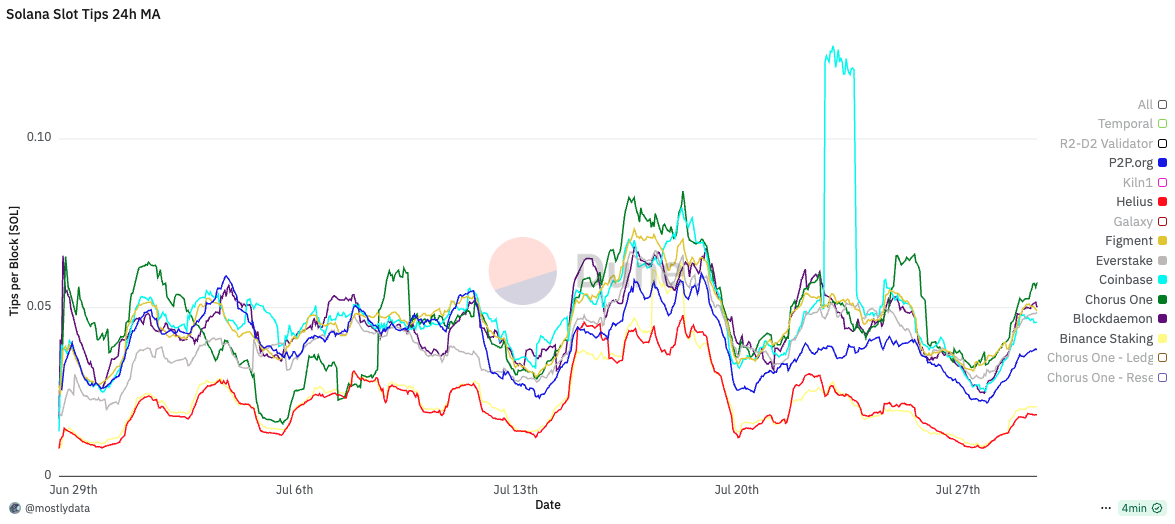
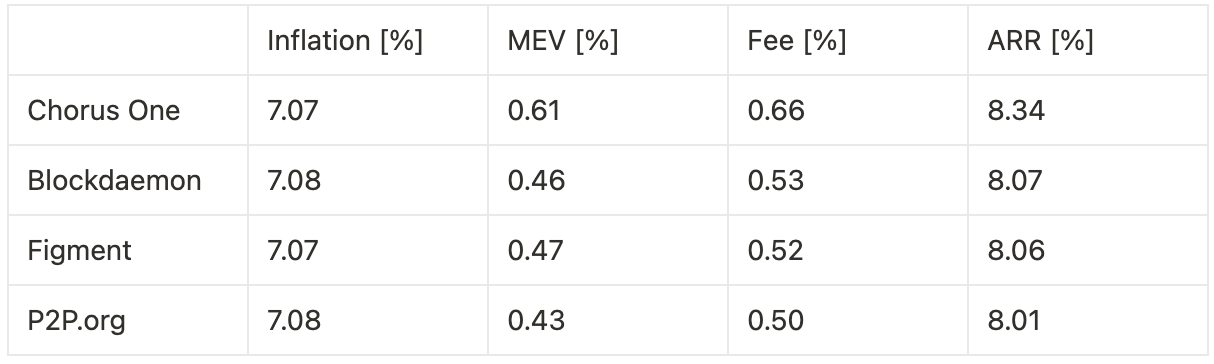
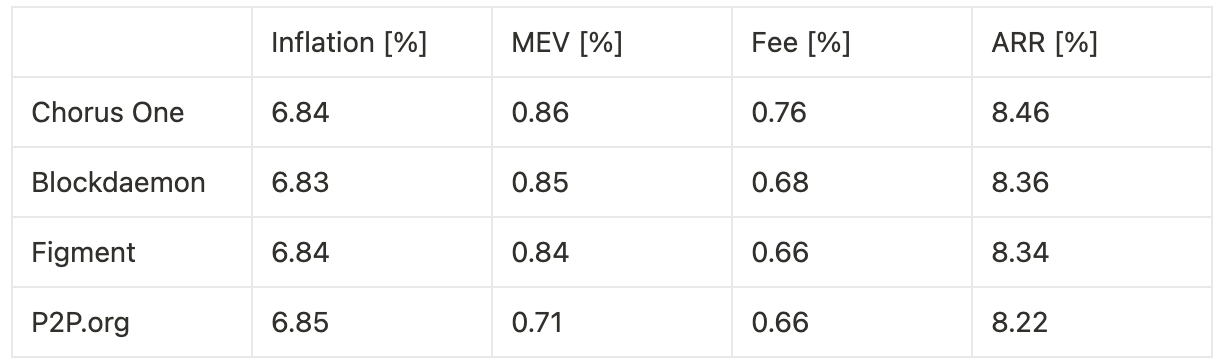
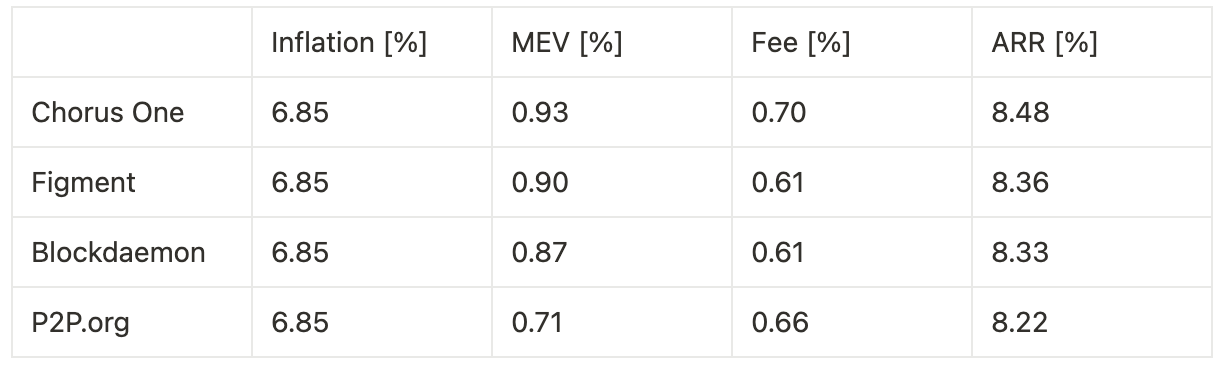
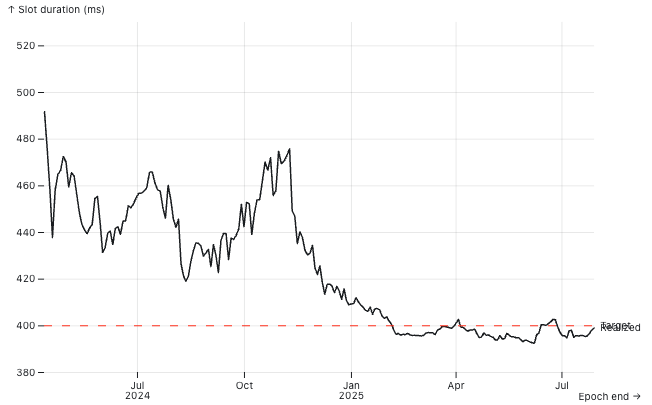
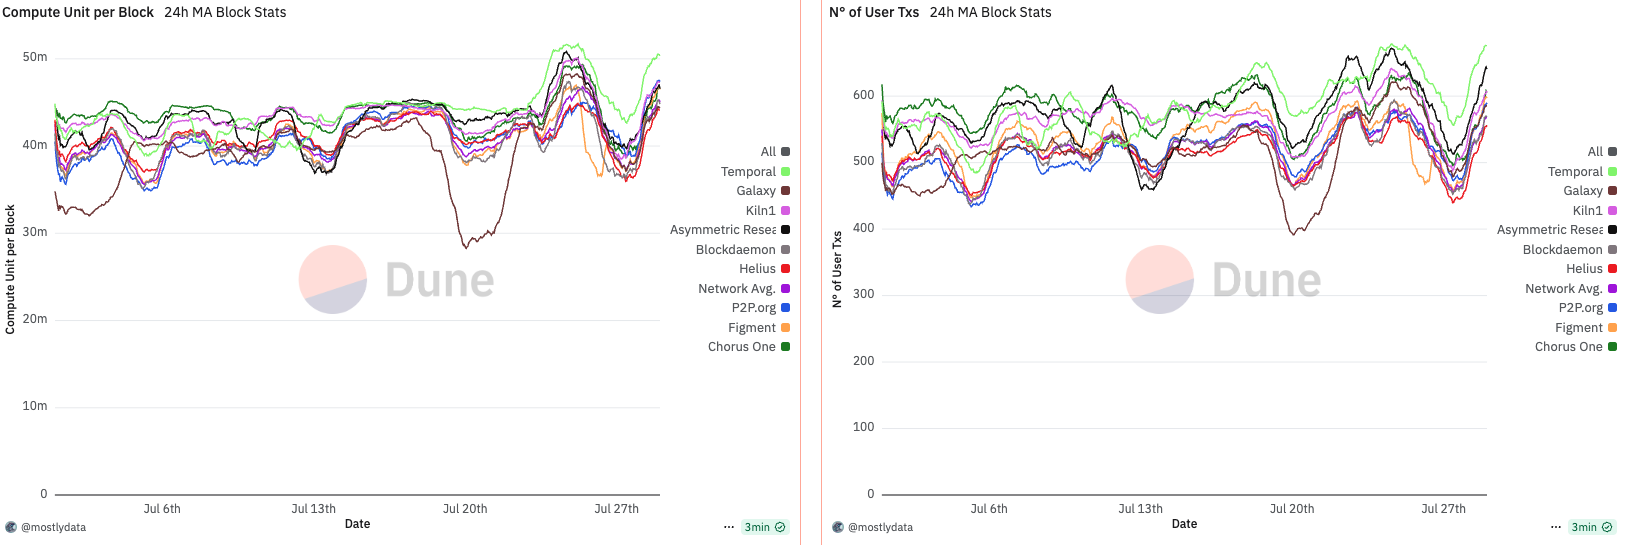
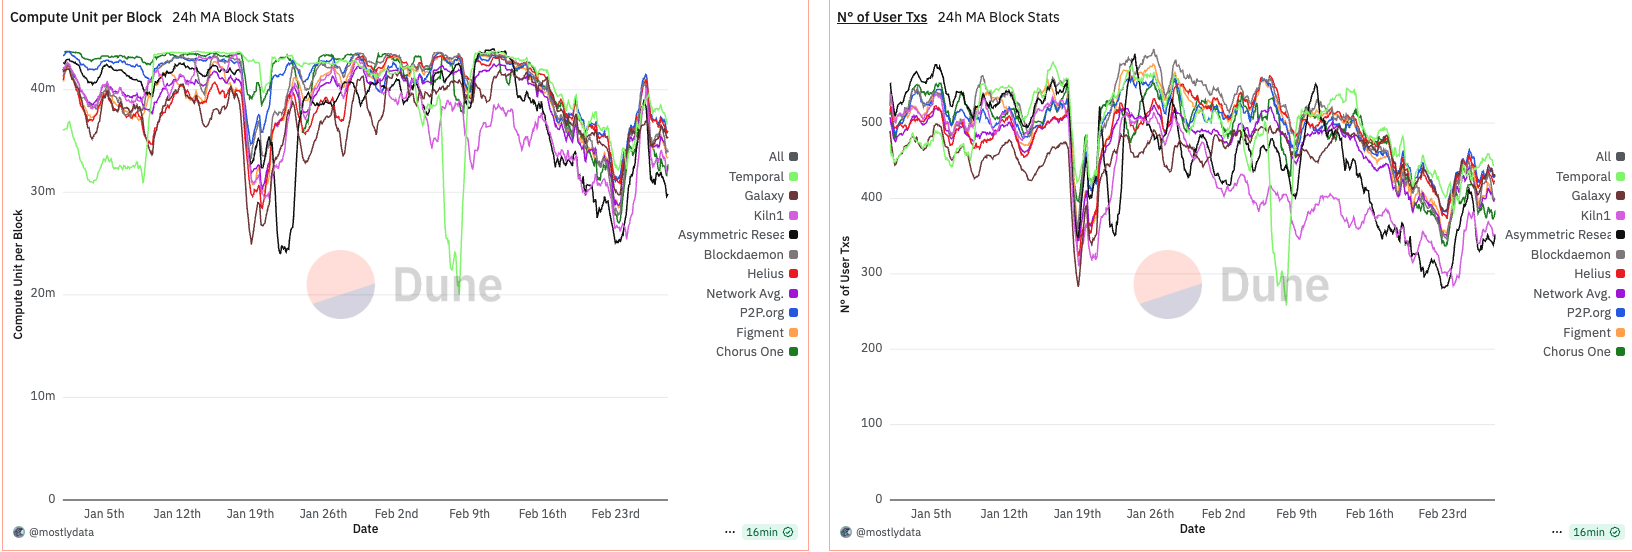
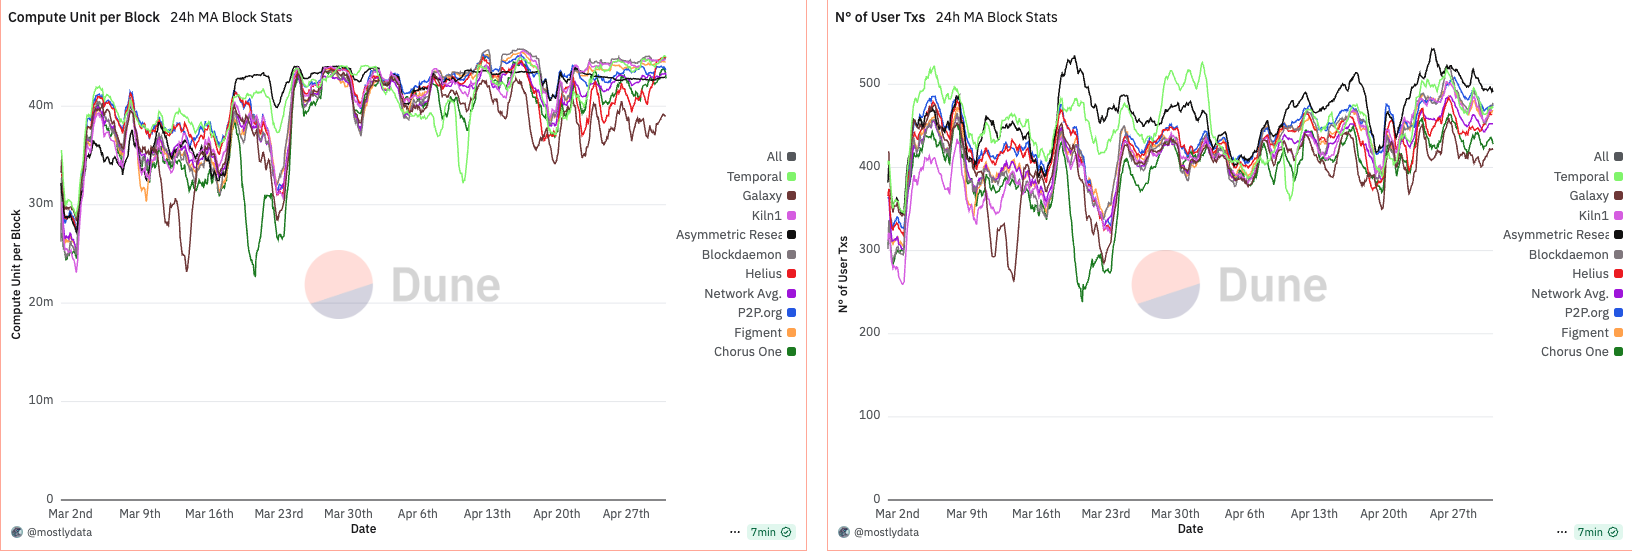
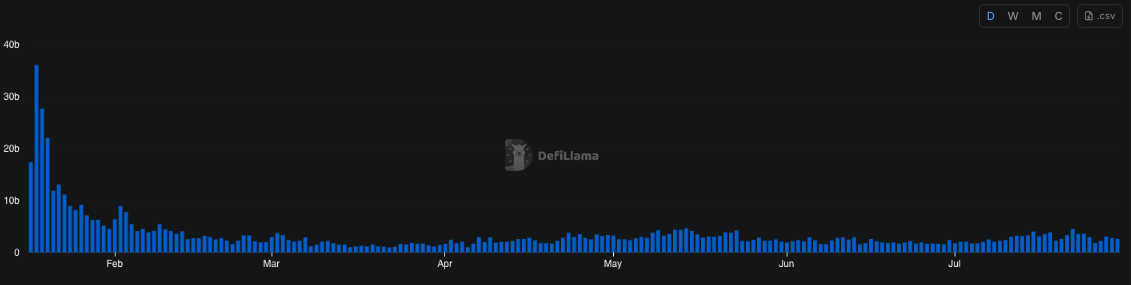
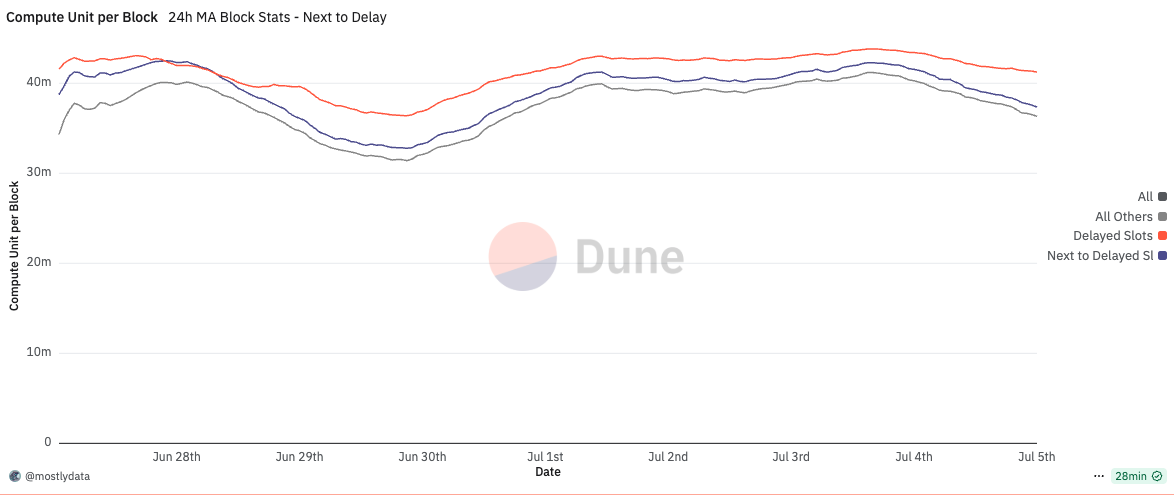
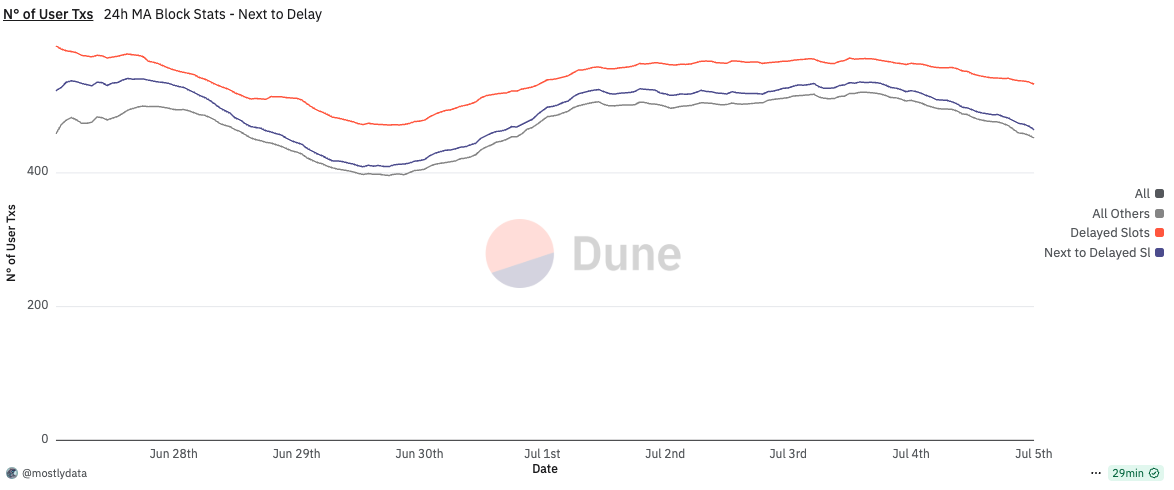
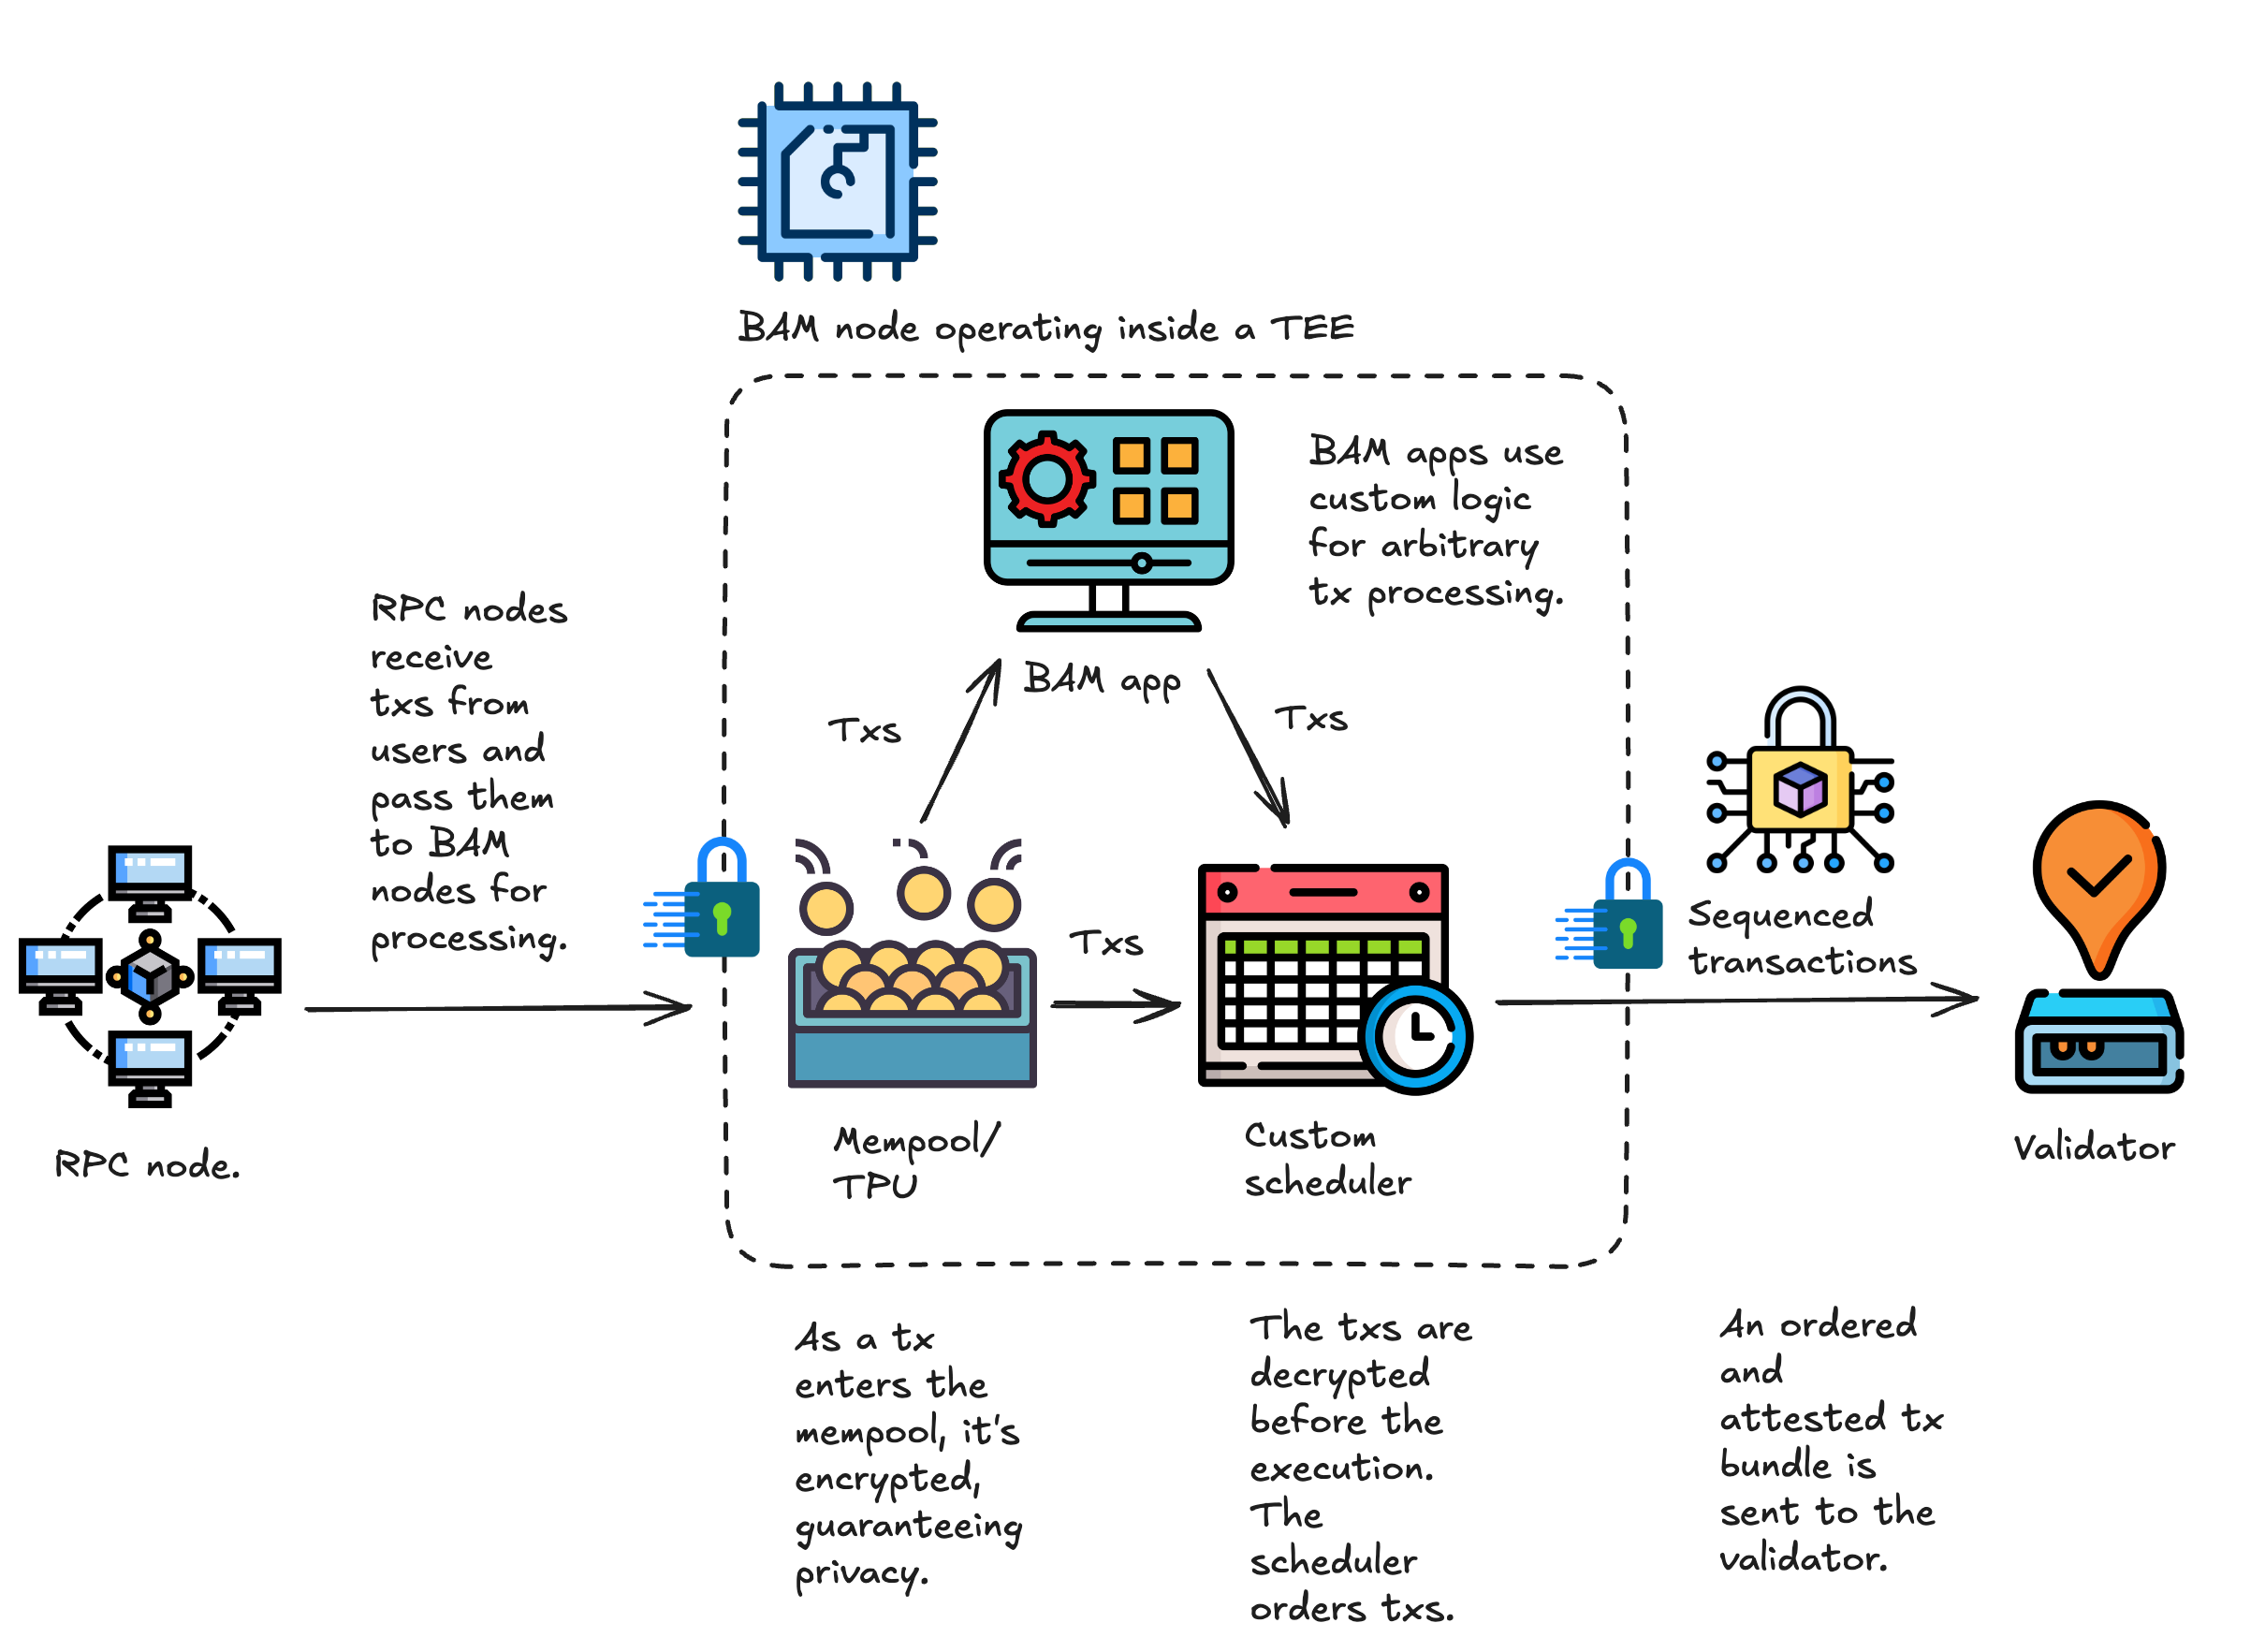
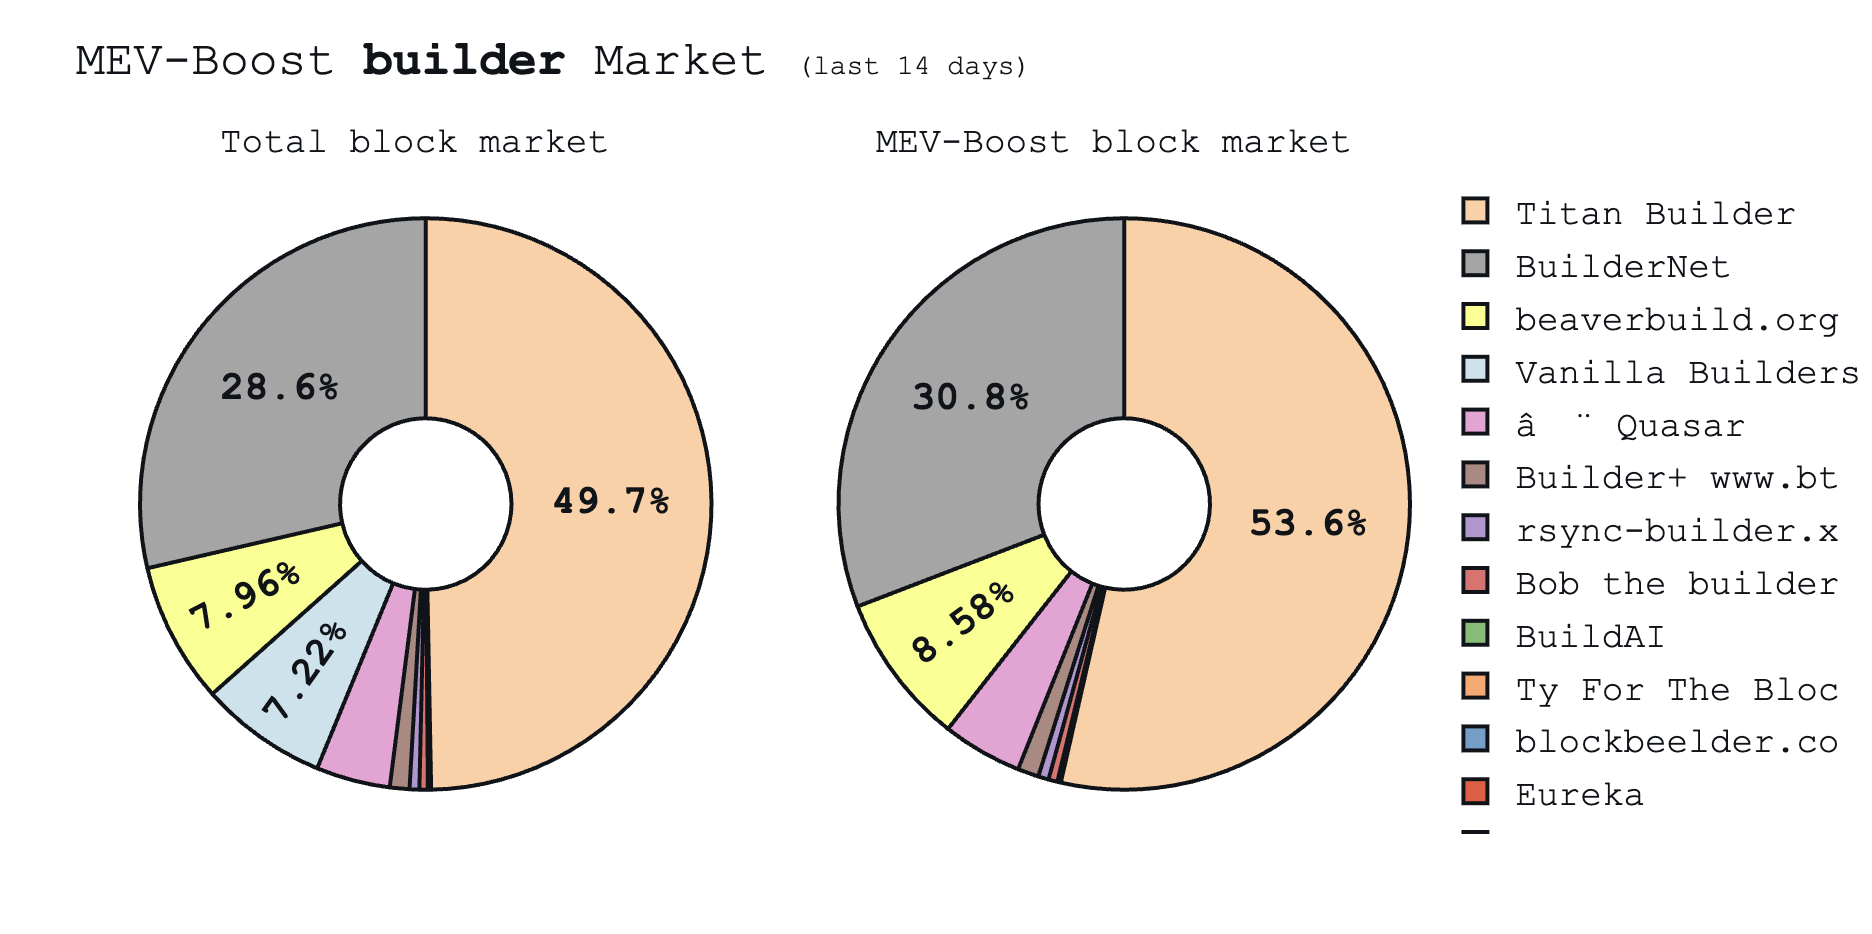
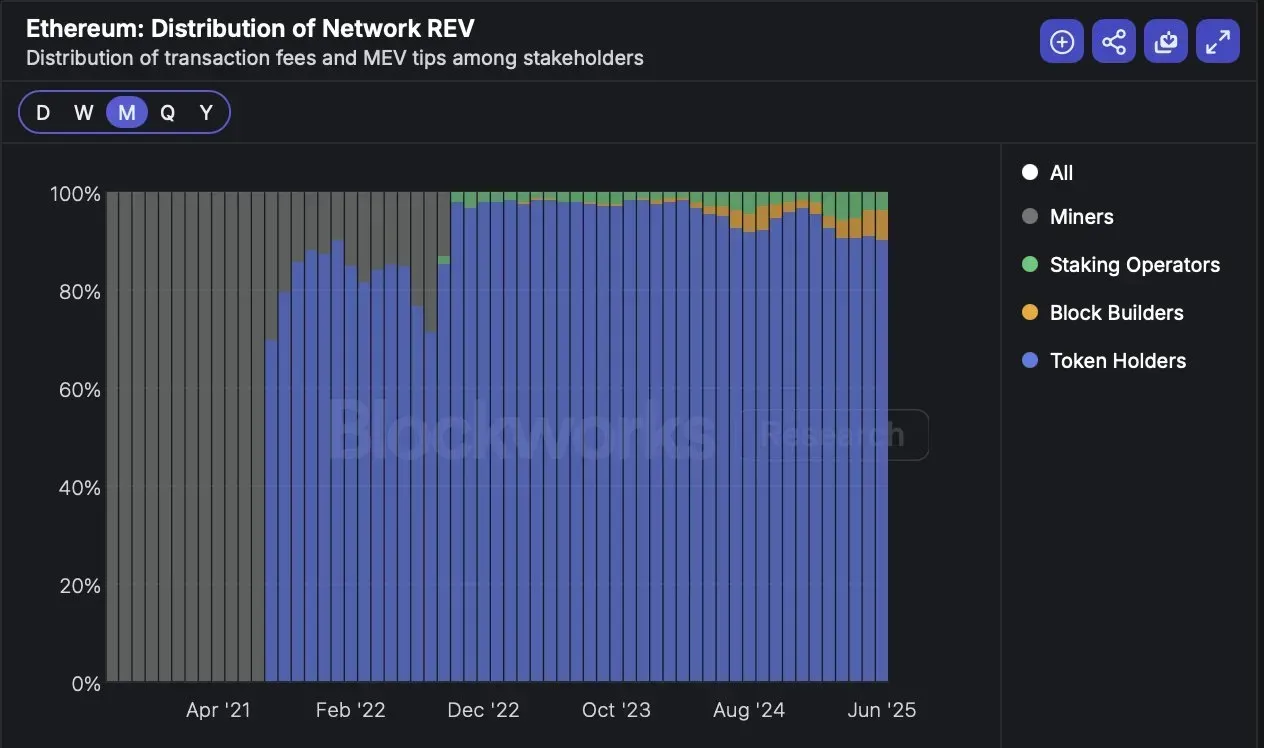


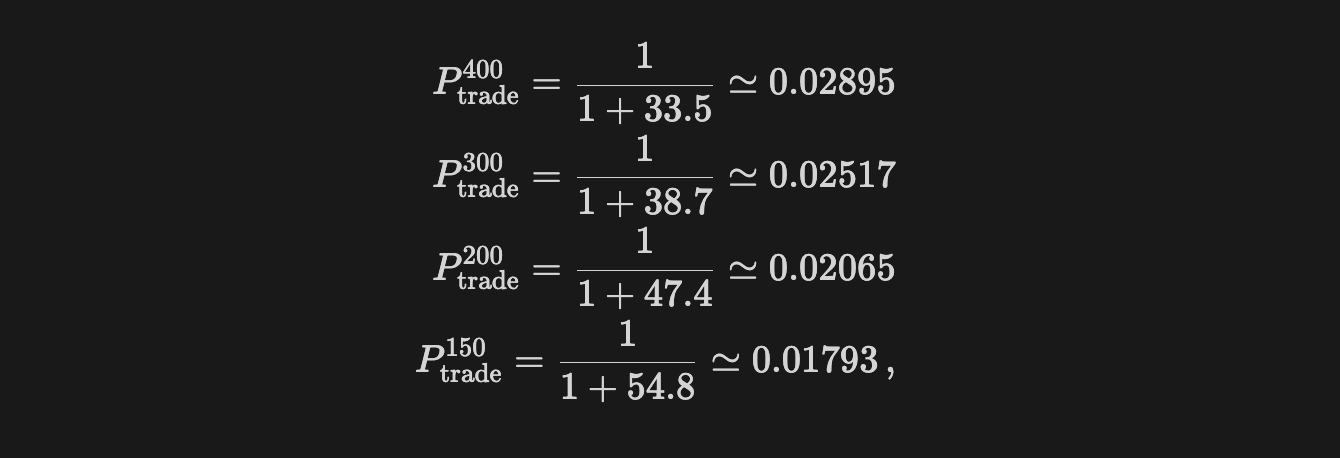


.png)


