Chorus One is now a part of Bitwise. Bitwise is a global, crypto-first asset manager with $11 billion+ in client assets and a diverse suite of investment solutions. Learn more about how Chorus One is growing as a part of Bitwise at onchain.bitwiseinvestments.com.
Oops! Something went wrong while submitting the form.
Fill in the form below to download the report
Thank you! Your submission has been received!
Oops! Something went wrong while submitting the form.
Fill in the form below to download the report
Thank you! Your submission has been received!
Oops! Something went wrong while submitting the form.
Fill in the form below to download the report
Thank you! Your submission has been received!
Oops! Something went wrong while submitting the form.
Crypto Research You Can Trust
The crypto space is evolving rapidly and can get daunting for investors. That is why we have a dedicated team of researchers who turn the complex technical advancements in the field into easily understandable research reports. These reports are highly valued by institutions and investors who want to stay up-to-date with the latest developments in the crypto world.
The State of Schedulers on Solana
Streaming, Batching, and the Economics of Execution Timing
Most blockchains were built as shared infrastructure. Everyone using the network competes for the same resources, follows the same rules, and lives with the same constraints. That works well for open markets and trading applications. It creates problems for regulated financial institutions that need predictable costs, compliance controls, and the ability to decide who participates in their network.
Avalanche was designed around a different premise. Rather than forcing all participants onto a single shared chain, it is a platform for creating purpose-built financial networks (called Avalanche L1s). A bank can operate its own network with its own rules and its own list of permitted participants. Each L1 has its own dedicated validators and does not share traffic or compete for resources with others, while remaining interoperable with the broader Avalanche ecosystem through Interchain Messaging (ICM).
Settlement on Avalanche is confirmed in under two seconds and cannot be reversed. A transaction is either pending or final. Transaction costs run at fractions of a cent following the Avalanche9000 upgrade in late 2024. This combination of speed, low cost, and customisability has made Avalanche a leading platform for institutions working on tokenisation, settlement, and payments.
On 17 March 2026, the SEC and CFTC jointly classified AVAX as a digital commodity, the same regulatory category as Bitcoin and Ether, as part of a broader 16-asset designation. This removes years of legal uncertainty and opens the door for institutional products such as ETFs and structured instruments. The classification is currently interpretive guidance, not permanent law. Congress is working to codify it through the CLARITY Act.
The Avalanche architecture
Avalanche is not a single blockchain. It has a primary network at its core containing three specialised chains, each built for a specific job. On top of that foundation, institutions can launch their own custom networks (Avalanche L1s) with their own rules, their own participants, and their own compliance logic.
The P-chain is the administrative layer. It keeps track of every validator on the network, manages who is staking, how much, and distributes rewards.
The X-chain handles the movement of assets. It is optimised for speed and low cost, designed specifically for transferring value rather than running complex logic.
The C-chain is where applications live. It is fully compatible with the Ethereum Virtual Machine, which means institutions and solidity developers can use familiar tools and deploy existing code without starting from scratch.
Custom networks sit below this foundation. Each one is isolated and operates under its own rules, but every transaction it processes is ultimately secured by the primary network above it. Two institutions can run entirely separate chains with no shared activity, and still settle transactions between them when needed. This is the feature that sets Avalanche apart from general-purpose blockchains: an institution's network only carries its own traffic, which means fees stay stable, throughput is predictable, and compliance logic is built into the protocol rather than added on later.
What major institutions are building on Avalanche
Entity
Category
Action
Date
Source
Visa
Payments
Added Avalanche for global stablecoin settlement (USDC, USDG, EURC)
Each deployment reflects a different set of requirements. Visa needed settlement infrastructure its global partners could plug into without operational complexity. Progmat needed a network that would satisfy Japanese regulators and connect domestic security tokens to international investors.
In each case the decision came down to the same practical criteria: fast settlement, predictable costs, customisable compliance controls, and EVM compatibility.
Staking: earning rewards on Avalanche
Avalanche is secured through proof-of-stake. Validators commit AVAX tokens to the network and earn rewards in return for providing that security. Stakers (also called delegators) can take part without running a node themselves, by locking up their AVAX with a validator they choose. Both earn rewards, paid in newly issued AVAX. As of June 15, 2026, a participant who stakes for the maximum one-year period earns a reward rate of approximately 6.3% per year.
These rewards are not funded by transaction fees. Instead, the protocol issues new AVAX according to a fixed emission schedule, subject to a permanent maximum supply of 720 million tokens that cannot be exceeded. Separately, all transaction fees on Avalanche are burned, permanently removing those tokens from circulation and partially offsetting new issuance.
The reward rate is not fixed and changes over time. The protocol sets it automatically using a formula tied to how much AVAX has already been issued:
Rate = (Max Supply − Current Supply) ÷ Current Supply × Consumption Rate
Two elements drive the rate. First, as the circulating supply grows toward the 720 million cap, the "Maximum Supply − Current Supply" term shrinks, the pool of AVAX still available to be minted gets smaller and the reward rate gradually declines. Second, longer stakes earn more than shorter ones, up to a maximum consumption rate of 12% for a full one-year lock. The yield a staker actually keeps is lower than the headline rate, because validators charge a commission on the staking rewards.
The rate can be verified directly against the network. The only input that changes day to day is the current AVAX supply, which is read directly from the Avalanche blockchain. As of June 15, 2026, the supply was approximately 472.4 million AVAX, leaving 247.6 million to be issued before the 720 million cap. Applying the formula gives a nominal one-year reward rate of (247.6M ÷ 472.4M) × 12% ≈ 6.3%.
For institutional clients, the most direct route to earning staking rewards is through a professional validator operator. Bitwise Onchain Solutions operates validator infrastructure on Avalanche and manages this process on behalf of clients, handling uptime monitoring, infrastructure maintenance, and reward collection.
Disclosure:
The staking reward rate shown is derived from the Avalanche protocol's on-chain reward formula using the current AVAX supply of approximately 472.4 million AVAX, queried directly from the Avalanche P-Chain as of June 15, 2026, a maximum supply of 720 million AVAX, a maximum consumption rate of 12%, and a one-year staking period. Staking rewards are variable and not guaranteed. They may fluctuate or fall to zero depending on the total AVAX supply, the amount staked, protocol parameters, and validator performance, including the network's uptime requirements. For BAVA, any rewards earned accrue to the Fund and should not be taken as an indication of future performance.
The lock-up structure is the most important consideration for institutional clients. Staking durations on Avalanche range from a minimum of 2 weeks to a maximum of 1 year, and any duration within that window can be selected at the point of staking. Once committed, the position cannot be exited early and the parameters cannot be changed. The chosen duration should align with the client's liquidity planning accordingly.
This structure is likely to evolve. Avalanche has an active governance proposal (ACP-236) that would introduce continuous staking for validators, allowing them to remain staked indefinitely with automatic cycle renewals and optional reward compounding. Validators define their own cycle duration within the existing two-week to one-year range, and the position auto-renews at the end of each cycle. A validator can signal an exit at any point during a cycle, but capital remains locked until that cycle completes.
There is no slashing risk on Avalanche. The staked principal is fully protected at all times. If a validator fails to meet the uptime threshold, it simply does not earn rewards for that period. This is why choosing an operator with robust infrastructure and monitoring is important.
Three ways to access and gain exposure to Avalanche through Bitwise
Direct staking suits clients who hold AVAX and want full rewards exposure through dedicated infrastructure. Bitwise Onchain Solutions operates validators across more than 20 proof-of-stake networks and manages the full technical stack: uptime monitoring, reward collection, and reporting. The client retains ownership of the underlying tokens throughout.
The AVNB ETP was built specifically for clients who need daily liquidity. It holds AVAX in institutional cold-storage custody, stakes a portion of the holdings, and adds the staking rewards to the net asset value each day. Clients trade in and out on Deutsche Börse Xetra like any other exchange-traded product, without any lock-up period or operational complexity on their side. It has been listed since October 2025.
The BAVA ETF is the US-market equivalent. Once live, it will stake up to 70% of its holdings and pass the rewards directly to investors, making it one of the first rewards-bearing crypto ETFs in the United States. The gross expense ratio of 0.34% reflects Bitwise's commitment to offering the most cost-efficient access to AVAX staking available to US investors.
Why Bitwise
Bitwise brings together two capabilities that are rarely combined in one firm: deep blockchain infrastructure expertise and the institutional credibility of a regulated asset manager.
On the infrastructure side, Bitwise Onchain Solutions operates validators across more than 20 proof-of-stake networks, managing several billion dollars in staked assets. The team that built the non-custodial Ethereum staking tools now used by the Ethereum Foundation itself is part of Bitwise Onchain Solutions. That institutional pedigree is the same infrastructure powering our Avalanche validator operations.
On the product side, Bitwise has been building regulated access to digital assets since 2017, serving over 5,000 wealth managers, RIAs, family offices, and institutional investors. The AVNB ETP, the BAVA ETF, and our direct staking service are all expressions of the same belief: that institutional clients deserve professional, regulated access to blockchain infrastructure without having to manage the technical complexity themselves.
For clients looking to understand Avalanche, evaluate staking, or explore how blockchain infrastructure might fit into a broader portfolio, Bitwise Onchain Solutions is ready to go deeper.
Risks and Important Information
This material must be accompanied by a prospectus. To get this document for free, please visit bava.com/welcome.
The Bitwise Avalanche ETF (BAVA) is not suitable for all investors. An investment in BAVA is subject to a high degree of risk, has the potential for significant volatility, and could result in significant or complete loss of investment. BAVA is not an investment company registered under the Investment Company Act of 1940, as amended (the “1940 Act”) and therefore is not subject to the same protections as ETFs and mutual funds registered under the 1940 Act. An investment in BAVA is not a direct investment in Avalanche (AVAX-USD).
Shares of ETPs are bought and sold at market price (not NAV) and are not individually redeemed from the Fund. Brokerage commissions will reduce returns. The NAV may not always correspond to the market price of AVAX-USD and, as a result, Creation Units may be created or redeemed at a value that is different from the market price of the Shares. Authorized Participants’ buying and selling activity associated with the creation and redemption of Creation Units may adversely affect an investment in the Shares.
The amount of AVAX-USD represented by a Share will continue to be reduced during the life of the Fund due to the transfer of the Fund’s AVAX-USD to pay for the Sponsor’s management fee, and to pay for litigation expenses or other extraordinary expenses. This dynamic will occur irrespective of whether the trading price of the Shares rises or falls in response to changes in the price of AVAX-USD.
There is no guarantee or assurance that the Fund’s methodology will result in the Fund achieving positive investment returns or outperforming other investment products.
Investors may choose to use the Fund as a means of investing indirectly in AVAX-USD. Because the value of the Shares is correlated with the value of the AVAX-USD held by the Fund, it is important to understand the investment attributes of, and the market for, AVAX-USD.
AVAX-USD Risk. There are significant risks and hazards inherent in the AVAX-USD market that may cause the price of AVAX-USD to fluctuate widely. The Fund’s AVAX-USD may be subject to loss, damage, theft or restriction on access. Investors considering a purchase of Shares should carefully consider how much of their total assets should be exposed to the AVAX-USD market, and should fully understand, be willing to assume, and have the financial resources necessary to withstand the risks involved in the Fund’s investment strategy.
Liquidity Risk. The market for AVAX-USD is still developing and may be subject to periods of illiquidity. During such times it may be difficult or impossible to buy or sell a position at the desired price. Possible illiquid markets may exacerbate losses or increase the variability between the Fund’s NAV and its market price. The lack of active trading markets for the Shares may result in losses on investors’ investments at the time of disposition of Shares.
Regulatory Risk. Future and current regulations by a U.S. or foreign government or quasi-governmental agency could have an adverse effect on an investment in the Fund.
Blockchain Technology Risk. Certain of the Fund’s investments may be subject to the risks associated with investing in blockchain technology. The risks associated with blockchain technology may not fully emerge until the technology is widely used. Blockchain systems could be vulnerable to fraud, particularly if a significant minority of participants colluded to defraud the rest. Because blockchain technology systems may operate across many national boundaries and regulatory jurisdictions, it is possible that blockchain technology may be subject to widespread and inconsistent regulation.
Staking Risk. The Trust intends to implement a staking program under which a significant portion of the Trust’s AVAX-USD will be staked. While staking AVAX-USD offers the potential to earn rewards in the form of additional AVAX tokens, it also exposes the Trust to several risks, such as loss of rewards, slashing penalties, and operational uncertainties. Staking activities could impair the ability to satisfy redemption orders on a timely basis.
Nondiversification Risk. The Fund is nondiversified and will hold a single issue. As a result, a decline in the market value of a particular issue held by the Fund may affect the Fund’s value more than if it invested in a larger number of issuers.
Recency Risk. The Fund is recently organized, giving prospective investors a limited track record on which to base their investment decision. If the Fund is not profitable, the Fund may terminate and liquidate at a time that is disadvantageous to Shareholders.
Bitwise Investment Advisers, LLC serves as the sponsor of the Fund. Foreside Fund Services, LLC serves as the Marketing Agent for AVAX, and is not affiliated with Bitwise Investment Advisers, LLC, Bitwise, or any of its affiliates.
Nothing herein constitutes investment, legal, tax or accounting advice, nor a recommendation to
participate in any staking activity. Clients retain full discretion over all decisions relating to digital assets and staking participation.
Crypto asset trading requires knowledge of crypto asset markets. In attempting to profit through crypto asset trading, you must compete with traders worldwide. You should have appropriate knowledge and experience before engaging in substantial crypto asset trading. Crypto asset trading can lead to large and immediate financial losses. Under certain market conditions, you may find it difficult or impossible to liquidate a position quickly at a reasonable price.
The opinions expressed represent an assessment of the market environment at a specific time and are not intended to be a forecast of future events, or a guarantee of future results, and are subject to further discussion, completion and amendment. The information herein is not intended to provide, and should not be relied upon for, accounting, legal or tax advice, or investment recommendations. You should consult your accounting, legal, tax or other advisors about the matters discussed herein.
Staking is provided by Attestant Ltd. Doing business as “Bitwise Onchain Solutions” (“BOS”)
Scheduler design determines execution timing and ordering, not value creation. Welfare effects arise only once execution outcomes are evaluated through agent-specific losses.
Concepts such as “better ordering” or “higher-value blocks” are ill defined without an explicit welfare model.
Execution behaviour can be characterized empirically using an ordering observable (the scheduler footrule distance), allowing distinct scheduler regimes to be identified on chain.
Under independent transaction arrivals, immediate execution with minimal buffering (Streaming) minimizes aggregate delay and Pareto-dominates batching-based schedulers across most preference profiles.
Under systematic, time-coupled competition, buffering transactions over short windows reduces race volatility and can strictly improve welfare by stabilizing execution outcomes.
Batching improves welfare only for specific preference structures, namely when losses are dominated by fee competition or by race outcomes under noisy arrivals.
Batching is structurally misaligned with deadline-driven workloads: when welfare is dominated by absolute execution time, added latency directly increases loss and cannot be offset by smoother ordering or lower fees.
No scheduler is universally optimal. Scheduler choice must be aligned with the arrival regime and with the dominant source of welfare loss faced by the agent population.
Scheduler optimality lies on a continuum: batching converges to streaming as the batch window shrinks, suggesting that adaptive or data-driven batch sizing may better serve heterogeneous ecosystems.
Execution scheduling is therefore an economic design problem, not a purely technical one.
1. Introduction
Transaction scheduling is a central design choice for high-throughput blockchains. Under congestion, schedulers determine which transactions execute first, which are delayed, and how conflicts are resolved. Despite this, discussions of scheduler quality are often framed in terms of loosely defined objectives such as higher value blocks, better ordering, or stronger priority enforcement. While intuitively appealing, these notions are ill defined in the absence of an explicit mapping to economic outcomes: properties of execution ordering are not intrinsically meaningful and can only be evaluated through the losses they induce on the agents submitting transactions.
This ambiguity is not merely theoretical. On Solana, the network does not operate under a single, uniform execution policy, but under a plurality of effective schedulers. Differences in client implementations, buffering strategies, conflict handling, and priority enforcement result in markedly different execution outcomes for users and applications, even when submitting economically similar transactions. In such an environment, claims about a “better” or “worse” scheduler cannot be grounded in execution mechanics alone. Absent a welfare-based interpretation, they reduce to statements about internal behaviour rather than system-level outcomes.
This paper therefore starts from the observation that the notion of a “best block” is not well defined unless it is grounded in agent welfare.
1.1 Why “Best Block” is ill Defined
Several commonly invoked criteria for scheduler quality illustrate this ambiguity:
Higher value blocks: A block that extracts more fees or priority payments does not necessarily improve outcomes for users or applications. Increased fee revenue may reflect intensified competition or rent extraction rather than welfare gains.
Better ordering: Ordering transactions “more cleanly” or “more consistently” has no intrinsic meaning unless one specifies which agents benefit from earlier execution and which incur losses from delay.
Stronger priority enforcement: Enforcing priority more strictly improves the correlation between bids and execution rank, but this merely reallocates execution advantage toward agents with higher willingness or ability to pay. Whether this improves or worsens social outcomes depends on the underlying preference structure.
In all cases, these criteria describe properties of execution, not outcomes. They become meaningful only once execution timing and ordering are evaluated through agent-specific loss functions.
Consequently, scheduler design is unavoidably a welfare problem: schedulers do not create value, but allocate delay, ordering risk, and fee efficiency under contention.
1.2 Scheduler Design as a Welfare Problem
Transactions on a blockchain are submitted by heterogeneous agents with different objectives, latency profiles, and tolerance to execution delay. For some agents, absolute timeliness dominates; for others, relative ordering matters; for others still, fee expenditure is the primary concern. Identical execution outcomes can therefore improve welfare for some participants while worsening it for others.
A scheduler determines execution outcomes but does not assign value to them. Losses arise only once outcomes are evaluated through agent preferences. As a result, no scheduler can be evaluated in isolation from the losses it induces.
This observation has a methodological implication: any welfare analysis of scheduler design requires a way to translate execution behaviour into losses. To do so, execution ordering must first be represented in a quantifiable and comparable way.
Welfare modelling requires knowledge of when transactions execute and in what relative order. However, execution behaviour on a live network is shaped by multiple interacting factors, including stochastic arrival times, network propagation, conflict constraints, and scheduler logic. Aggregate block-level statistics—such as compute usage, block fullness, or fee revenue—do not isolate the contribution of the scheduler itself.
To connect scheduler design to welfare outcomes, we therefore require a block-level observable that:
Summarizes realized execution ordering
Is comparable across blocks of different sizes
Is interpretable independently of agent preferences
Can be measured empirically on chain.
In Sec. 2, we introduce such an observable and show how it can be used to map observed execution behaviour to a small set of scheduler primitives. In Sec. 3, we define welfare and introduce the evaluation criteria used throughout the paper. Subsequent sections study how welfare varies across scheduling regimes and agent configurations.
2. Execution Ordering as a Measurable Object
The welfare analysis developed in this paper requires a representation of execution behaviour that is both empirically observable and abstract enough to be evaluated independently of agent preferences. In this section, we introduce such a representation by focusing on realized execution ordering within blocks. We construct a block-level observable that summarizes how transactions are ordered in practice and show how this observable can be used to map on-chain behaviour to a small set of scheduler primitives.
Throughout this section, we deliberately avoid normative interpretation. The goal is not to assess whether a given execution pattern is desirable, but to characterize how schedulers transform order flow into execution outcomes.
2.1 Execution Ordering and Scheduler Logic
The set of transactions executed in a block is the outcome of two intertwined mechanisms: order flow and scheduler logic. Order flow determines which transactions are visible to the leader and when, while scheduler logic governs how visible transactions are selected, ordered, and executed subject to conflict constraints.
Fig.1: Txs execution pipeline
As transactions arrive at the validator, the scheduler incrementally decides which transactions are runnable and in what order they should be executed. Transactions that touch disjoint state can, in principle, execute concurrently, while fully conflicting transactions must be serialized. The execution order recorded on chain corresponds to a linearization of this partially ordered execution, shaped jointly by arrival times, conflicts, and scheduler rules.
In practice, order flow is influenced by multiple network-level mechanisms, including propagation latency, stake-weighted quality of service, client-side routing policies, and local buffering behaviour. As a result, different validators may observe systematically different transaction sets and arrival patterns even under otherwise comparable network conditions. To isolate scheduler behaviour from these effects, it is useful to reason in an idealized limit.
Consider a hypothetical regime in which all transactions visible to a validator are available simultaneously. In this limit, fully conflicting transactions must be executed in strict priority order, while non-conflicting transactions may execute in an arbitrary order due to parallelism. Deviations from this idealized priority ordering therefore arise from the interaction between arrival-time stochasticity, conflict structure, and scheduler logic.
This observation motivates a comparison between realized execution order and a reference ordering derived from transaction priority.
2.2 Scheduler Footrule Distance
To quantify deviations from priority ordering, we introduce a block-level observable based on the Spearman footrule distance between two permutations of the same transaction set.
For each block, we consider:
rni: the realized execution order of transactions
prioi: the hypothetical order obtained by sorting the same transactions by priority per compute unit.
The footrule distance
measures the total displacement in rank between these two orderings. To enable meaningful comparison across blocks of different sizes, we normalize the distance by its maximum possible value, yielding a block-size–invariant quantity. We refer to this normalized metric as the scheduler footrule distance D, see Appendix A1.
By construction, the scheduler footrule distance summarizes how execution ordering reflects — or departs from — priority information once arrival-time randomness and conflict constraints are taken into account. Values close to zero indicate strong alignment with priority ordering, while larger values indicate increasing deviation.
Importantly, the scheduler footrule distance is not a welfare metric. It does not encode preferences, utilities, or losses. Rather, it is a behavioural observable that characterizes how a scheduler translates order flow into execution order, independently of how that order is valued by agents.
To anchor interpretation, we consider a null model in which the realized execution order is independent of transaction priority. This corresponds to treating block ordering as a uniformly random permutation of the transaction set. While this null model is not intended to describe Solana’s scheduler, it provides a useful reference for a regime in which arrival-time randomness dominates priority-based ordering. Under this random-permutation null, the expected scheduler footrule distance approaches D ≃ 2/3. Accordingly, values of D significantly below 2/3 indicate that priority information is meaningfully reflected in execution, despite stochastic arrival effects. Conversely, values close to 2/3 are consistent with a regime dominated by arrival-time randomnsess. Value above 2/3 indicate that high-priority transactions are, on average, displaced farther from their priority ranks than would be expected under random ordering.
2.4 Empirical on-chain Distributions
Empirically, the distribution of the scheduler footrule distance D reveals that the network does not operate in a single homogeneous regime. At a coarse level, two broad behavioural classes are observed, see the bimodal distribution in Fig. 2.
However, a more granular analysis shows that these can be further decomposed into four distinct scheduler behaviours, corresponding to variations within the same underlying design philosophy, cfr. Fig. 3.
Fig.3: Distribution of the scheduler footrule distance across different validator implementations in the Solana network. Green-toned distributions correspond to Firedancer and Frankendancer, red to BAM, blu-toned distributions to Agave (with slot lagging — blue — and without — light blue), and grey to Harmonic .Source https://dune.com/queries/6365102/10123580.
These behaviours can be grouped as follows:
Mostly random (peak near 0.66) — arrival-dominated regime: In this regime, the realized ordering is close to the random-permutation baseline 𝔼[D] ∼ 2⁄3. The scheduler appears to commit transactions quickly, with limited opportunity to reorder by priority. This is consistent with a small effective lookahead or batch size, where stochastic arrival effects dominate over explicit priority sorting. Validators running Agave predominantly fall into this category.
Slightly different from random (peak ~ 0.6): Here, some priority information is reflected in the execution order, but only locally. This behaviour is consistent with limited reordering within small batches or shallow queues, where priority sorting is applied only over a restricted candidate set. Validators associated with BAM exhibit this behaviour.
Long tailed (peak ~ 0.6, with a pronounced left-tail): These distributions indicate a mixture of two regimes within the same validator. In particular, they are characteristic of state-dependent schedulers: under certain conditions (e.g., low load or sufficient buffering), the scheduler effectively batches transactions and enforces priority ordering (yielding low D); under other conditions (e.g., high arrival rate, queue saturation, or compute pressure), it behaves in a more streaming-like fashion, producing higher D. Such behaviour can naturally arise from internal thresholds, adaptive batching logic, or bursty order-flow. Harmonic validators fall into this category.
More aligned with priority (peak near 0.40-0.45): In this regime, priority information is clearly and consistently reflected in the realized execution order. This suggests a larger effective holding window, stronger priority enforcement, or more aggressive reordering before commitment. Arrival-time randomness is still present, but it is substantially mitigated by scheduler logic. This behaviour is observed for Firedancer / Frankendancer validators operating with slot lagging enabled.
Taken together, these observations indicate that while the network exhibits two main qualitative approaches — arrival-dominated versus priority-enforcing scheduling — each admits multiple concrete implementations, resulting in a richer landscape of observable execution behaviours.
Finally, in Appendix B we show that the observed variation in D reflects scheduler-level effects, rather than block-level resource constraints such as compute usage or block fullness.
2.5 Mapping Execution Ordering to Scheduler Primitives
The empirical distributions presented in Section 2.4 establish that Solana does not operate under a single execution regime, but they do not, by themselves, identify the underlying scheduling mechanisms responsible for the observed patterns. To interpret these distributions, we complement the on-chain analysis with controlled simulations designed to reproduce and explain the scheduler regimes identified via the footrule distance D.
The objective of these simulations is not to model Solana’s execution engine in full detail. Rather, the goal is to isolate a small set of scheduler primitives — minimal execution rules that differ only in buffering and reordering logic — and to determine whether these primitives induce systematically distinct distributions of D under identical order-flow conditions. This allows us to interpret empirical execution-ordering patterns in terms of underlying scheduling behaviour.
Simulation Framework
Transaction arrivals are modeled as a homogeneous Poisson process with rate λ, reflecting decentralized and asynchronous submission by independent agents. For a block horizon of duration T, the number of transactions N is drawn from Poisson(λT), and conditional on N, arrival times are i.i.d. and uniformly distributed on [0, T).
Each transaction is independently assigned a priority score p ∼ Unif(0, 1). This choice deliberately removes any correlation between arrival time and priority, ensuring that deviations from priority ordering arise solely from scheduler behaviour and arrival-time stochasticity, rather than from exogenous structure in the order flow.
For each simulated block, the priority-sorted order — obtained by sorting all transactions by decreasing priority — serves as the invariant reference against which realized execution order is compared via the scheduler footrule distance D.
Schedulers are assumed to be non-anticipative: at any point in time, they may only reorder transactions that have already arrived. This constraint captures the online nature of block production and is essential for generating deviations from the priority-sorted reference.
Scheduler primitives
We consider four scheduling policies, each corresponding to a distinct operational regime and mapping directly onto one of the empirical D-distributions observed on chain:
Streaming (arrival-ordered execution with local tie-breaking via priority): Transactions are executed as soon as they become runnable, with minimal buffering. When multiple runnable transactions are available simultaneously — due to discrete ingestion, queue flushes, or parallel arrival — priority is used only as a local tie-breaker. This policy represents an arrival-dominated regime with minimal lookahead and is expected to produce execution orders close to a random permutation relative to priority.
Fixed time-batch scheduling: Time is partitioned into fixed windows of width w. Transactions arriving within a window are buffered and executed at the end of the window in descending priority order, with batches processed sequentially. This policy enforces priority locally within batches but not across them. The batch width wcontrols the effective lookahead of the scheduler.
Wait-up-to-W: Upon the arrival of the first transaction, the scheduler buffers incoming transactions for up to a maximum duration W. When the waiting time elapses, a size threshold is reached, or the block horizon ends, buffered transactions are executed in descending priority order, after which execution proceeds in streaming mode. This policy represents a bounded-latency scheduler that dynamically trades off buffering against delay.
Timing Game (strategic horizon extension): In this regime, the scheduler deliberately extends the effective transaction collection horizon beyond the nominal block cutoff T, executing transactions arriving in a late window [T, T + Δ). The uniform-priority assumption is relaxed: transactions arriving in the late window are assigned priorities drawn from a distribution with higher expected value than those arriving earlier, modelling non-stationary order flow driven by market dynamics, congestion, or strategic submission behaviour. This modification is introduced solely to capture the defining feature of timing games and is not used elsewhere in the simulation framework.
Figure 4 shows the resulting distributions of D for these primitives in the absence of transaction conflicts.
Fig. 4: Simulation of different scheduler behaviour and relative scheduler footrule distance distribution. Here conflicting transactions are not taken into account.
Interpretation and role of conflicts
Despite the simplified setting, the simulations reproduce the qualitative ordering signatures observed on chain. Each scheduler primitive isolates a fundamental mechanism — immediate commitment, periodic batching, bounded waiting, or strategic delay — that can be directly identified in empirical D-distributions.
In this sense, the simulation framework should be interpreted not as a literal model of Solana’s scheduler, but as a basis decomposition: a minimal set of behavioural components whose superposition reproduces the observed landscape of execution behaviour.
The baseline simulations abstract away conflicts between transactions. When conflicts are explicitly incorporated, two effects emerge. First, even under identical scheduling rules, the distribution of D becomes broader and more heavy-tailed, reflecting the additional constraints imposed by conflict resolution. Second, this increased dispersion closely matches empirical on-chain observations, where high-contention accounts and bursty order flow routinely induce large deviations from idealized priority ordering (Fig. 5).
Fig. 5: Simulation of different scheduler behaviour and relative scheduler footrule distance distribution. Here we take into account also conflicting transactions.
Conflicts are introduced through a reduced-form execution model that approximates parallel execution across multiple workers. Time is discretized into PoH ticks, and only a limited number of transactions touching a given conflict account may contribute to the block’s linearized execution order per tick. This representation captures the essential feature that conflicting transactions must be serialized, while non-conflicting transactions may execute concurrently.
These results indicate that a substantial fraction of the observed variability in D arises from the interaction between scheduler logic and conflict resolution, rather than from arrival-time stochasticity alone. Incorporating conflicts therefore brings the observable closer to the operational reality of Solana blocks, while preserving its role as a compact, block-level summary of execution ordering.
Finally, we exclude timing-game regimes from the welfare analysis that follows. Timing games represent explicitly extractive behaviour achieved by extending slot duration on top of a given scheduling rule, rather than a distinct execution primitive. Since our objective is to study welfare implications of scheduler design under a fixed block horizon, these regimes fall outside the scope of the analysis in subsequent sections.
3. Social Welfare under Contention
The analysis so far has characterized how schedulers transform order flow into execution ordering. We now address the complementary question: how do these execution outcomes affect the welfare of network participants?
Scheduler design does not directly generate value. Instead, it allocates execution timing and ordering under contention. Welfare effects arise only once these execution outcomes are evaluated through agent-specific preferences. As a result, identical execution orders may improve welfare for some agents while worsening it for others.
To study this interaction in a tractable and interpretable way, we introduce a minimal, reduced-form welfare model that maps execution outcomes to agent-level losses. The loss functions are not derived from an explicit optimization or equilibrium model; instead, their parameters should be interpreted as sensitivity weights, and the analysis as a comparative-static exploration of how different scheduling rules redistribute welfare across preference regimes, without modelling informational rents or payoff changes arising from faster execution.
This abstraction allows schedulers to be compared on welfare grounds while isolating the effects of execution mechanisms from strategic bidding behaviour or informational advantages.
3.2 A Minimal Two-Agent Welfare Model
We model the network as populated by two representative agents submitting fully conflicting transactions, so that execution is necessarily serialized. This abstraction captures the smallest unit of execution externality and applies equally to user–application interactions, bot–bot races, or competition between applications. The labels “user” and “application” should therefore be understood as roles with potentially different preferences, not as distinct economic categories.
Each agent i ∈ {U, A} is assigned a loss function
which maps execution outcomes into disutility, see Appendix D1 for a detailed description. The scheduler determines execution timing and ordering; losses arise only after these outcomes are evaluated through preferences.
Priority cost captures disutility from fee expenditure incurred to bid for earlier execution.
Delay cost captures sensitivity to execution latency, including deadlines and tail-risk penalties.
Ordering cost captures sensitivity to relative execution order when agents compete for the same state update.
This formulation is deliberately flexible: by varying preference parameters, it spans environments dominated by fee sensitivity, absolute timeliness, or race outcomes.
3.2 Latency Advantage as a Redistribution
When transactions are fully conflicting, execution is rivalrous: executing one transaction necessarily delays the execution of others touching the same state. In such settings, differences in arrival time can affect execution order even when transaction priorities are comparable.
Under arrival-dominated schedulers, transactions observed earlier by the leader are more likely to be executed first whenever contention is present. A systematic latency advantage for one participant therefore shifts early execution opportunities in its favour, increasing the waiting time of competing transactions. This effect arises mechanically from queue composition and scheduler logic and does not require adversarial behaviour or strategic intent.
A key modelling assumption of this paper is that latency does not confer informational advantage. Being faster affects when a transaction executes, but not what economic state it observes or what payoff it realizes conditional on execution. Formally, we assume that asset values follow a martingale with respect to public information, so that execution timing alone does not generate expected profit or loss beyond its impact on ordering and delay.
Under this assumption, latency advantages do not create surplus at the system level. Instead, they reallocate execution priority among competing agents: improvements in one participant’s execution timing necessarily come at the expense of others competing for the same execution resource. In the loss model introduced in this section, this assumption is reflected by the absence of any term directly linking latency to asset value or informational rents.
Accordingly, we treat latency asymmetry as a pure redistribution channel. Scheduler design matters because it determines how strongly arrival-time differences are translated into execution advantages, thereby shaping welfare outcomes through redistribution rather than value creation.
This assumption is consistent with recent theoretical results showing that, in the absence of informational advantages, speed alone reallocates surplus without increasing aggregate welfare. While this abstraction excludes settings such as price discovery or informational arbitrage — where execution speed may affect beliefs or payoffs — it allows us to isolate the welfare effects of scheduling rules under contention without conflating them with information-driven mechanisms.
3.3 Welfare Comparison across Scheduling Regimes
We compare scheduling regimes by evaluating the loss vectors (LU,\, LA) induced by each scheduler under heterogeneous agent preferences. To avoid imposing an arbitrary social welfare function, we adopt a Pareto-dominance criterion. For a fixed preference profile θ, a scheduler π is said to Pareto-dominate another scheduler π′ if it delivers weakly lower expected loss for both agents and strictly lower loss for at least one of them, up to a small tolerance τ. Concretely, π Pareto-dominates π′ if
with at least one inequality holding strictly. The tolerances τᵢ(θ) are defined as a fixed fraction of the corresponding loss scale. Differences within this band are treated as economically insignificant and classified as ties.
We evaluate Pareto dominance across a broad, non-restrictive parameter space spanning fee sensitivity, delay sensitivity, deadline penalties, tail-risk aversion, and ordering sensitivity. Preference profiles are sampled uniformly over this space; for each profile, expected losses are computed by averaging over many simulated slots to account for stochastic execution dynamics (arrival times, latency noise, and conflict resolution). Aggregating results across sampled profiles yields a Pareto win-rate matrix, reported in Figures 6-8.
Across the full parameter space and in the absence of systematic latency asymmetries, streaming execution emerges as the welfare-dominant regime, see Fig. 6. In the majority of preference profiles, streaming Pareto-dominates both fixed-window batching and bounded waiting policies. Where dominance does not obtain, outcomes are typically Pareto-incomparable: batching reduces losses for one agent class while increasing losses for the other. These cases correspond to redistribution, not welfare improvement.
Fig. 6: Pareto-dominance probability heatmaps for different schedulers. The left panel is computed using a 1% relative tolerance in the Pareto-dominance criterion. The right panel is computed without applying any relative tolerance threshold. Each cell reports the fraction of sampled preference profiles for which the scheduler on the row Pareto-dominates the scheduler on the column. Values near one indicate frequent Pareto dominance; intermediate values correspond to Pareto-incomparable outcomes.
Introducing user-side latency noise weakens but does not overturn this conclusion. Batching reduces variance in execution timing and partially shields latency-disadvantaged users, but does so by shifting delay and ordering costs onto applications. As a result, batching rarely yields Pareto improvements and primarily alters the distribution of welfare rather than increasing it, see Fig. 7.
Fig. 7: Pareto-dominance probability heatmaps for different schedulers assuming user-side latency noise (400ms jitter). The left panel is computed using a 1% relative tolerance in the Pareto-dominance criterion. The right panel is computed without applying any relative tolerance threshold. Each cell reports the fraction of sampled preference profiles for which the scheduler on the row Pareto-dominates the scheduler on the column. Values near one indicate frequent Pareto dominance; intermediate values correspond to Pareto-incomparable outcomes.
Restricting preferences to race- and fee-dominated losses clarifies the underlying mechanism. In these environments, batching dampens sensitivity to micro-timing differences and reduces losses for agents exposed to arrival-time noise. However, these gains are offset by increased losses for competing agents whose execution is delayed by buffering. No scheduler uniformly dominates in this regime, and Pareto incomparability becomes prevalent, see Fig. 8.
Fig. 8: Pareto-dominance probability heatmaps for different schedulers restricting the parameter space to pure race- and fee-based losses. The left panel is computed using a 1% relative tolerance in the Pareto-dominance criterion. The right panel is computed without applying any relative tolerance threshold. Each cell reports the fraction of sampled preference profiles for which the scheduler on the row Pareto-dominates the scheduler on the column. Values near one indicate frequent Pareto dominance; intermediate values correspond to Pareto-incomparable outcomes.
More generally, the welfare ranking of schedulers depends on the composition of agent preferences:
In balanced environments, where no agent class exhibits systematically stronger time sensitivity, immediate execution with minimal buffering minimizes aggregate delay and yields the highest social welfare.
In latency-race environments, batching acts as a buffering mechanism that redistributes execution advantages by reducing the impact of arrival-time asymmetries, but does not generate Pareto improvements.
No scheduler is universally optimal: scheduling rules implement different trade-offs between aggregate delay minimization and redistribution of execution priority under contention.
Importantly, these results are obtained without introducing informational asymmetries or extractive behaviour. The observed welfare trade-offs arise from structural properties of execution under contention, rather than from fine-tuned assumptions or strategic exploitation.
3.4 Systematic Competition and Time-Coupled Arrivals
The welfare analysis in Section 3.3 assumes that transactions arrive according to independent stochastic processes, so competitive interactions arise only incidentally through congestion. In many real-world settings, however, competing agents respond to the same external signal — such as a price movement, liquidation opportunity, or on-chain event — leading to time-coupled transaction submission.
To capture this regime, we extend the arrival model to allow transactions from competing agents to be generated in response to a common trigger, subject to reaction delays and bounded response windows. This induces systematic and repeated competition between agents. All other components of the model — scheduler definitions, execution mechanics, and loss functions — are held fixed, allowing us to isolate the effect of correlated arrivals on welfare outcomes.
Under time-coupled arrivals, the role of the scheduler changes qualitatively. Execution policies no longer merely resolve incidental congestion, but repeatedly shape the outcomes of execution races under timing uncertainty. As a result, the welfare ranking of schedulers differs fundamentally from the independent-arrival regime.
Fig. 9: Pareto-dominance probability heatmaps for different schedulers in the case of systematic competition between agents. The left panel is obtained using the whole parameter space, representing heterogeneous agent composition. The right panel is obtained considering only time-sensitive agents. Each cell reports the fraction of sampled preference profiles for which the scheduler on the row Pareto-dominates the scheduler on the column. Values near one indicate frequent Pareto dominance; intermediate values correspond to Pareto-incomparable outcomes.
Figure 9 reports Pareto-dominance probabilities across the preference space under systematic competition. Unlike the independent-arrival case, Streaming no longer Pareto-dominates alternative schedulers across the majority of profiles. While it continues to outperform longer waiting policies, FixedBatch strictly dominates Streaming over a non-negligible region of the parameter space, particularly when agents exhibit strong sensitivity to relative execution order.
This dominance reversal is driven by the structure of competition rather than by latency asymmetry. Immediate arrival-ordered execution exposes agents to repeated race losses when arrivals are time-coupled, translating micro-timing noise directly into welfare outcomes. By contrast, batching partially decouples execution outcomes from fine-grained arrival differences, reducing the frequency and severity of execution races. In environments where losses are dominated by ordering rather than absolute delay, this coordination effect outweighs the latency cost introduced by buffering.
Importantly, introducing user-side latency noise does not qualitatively alter this conclusion. While latency uncertainty affects the absolute level of losses, the regions of dominance observed in Fig. 9 are primarily shaped by systematic competition itself, not by protecting a latency-disadvantaged class of participants.
3.5 Regime Dependence of Scheduler Optimality
Taken together, the results of Sections 3.3 and 3.4 demonstrate that the Pareto-optimality of scheduling policies is fundamentally regime-dependent.
When transaction arrivals are independent and competition arises only incidentally through congestion, immediate execution with minimal buffering minimizes aggregate delay and Pareto-dominates alternative scheduling rules across most of the preference space. In this regime, batching primarily redistributes welfare between agents without generating Pareto improvements.
Under systematic, time-coupled competition, the dominance landscape changes qualitatively. Repeated execution races make relative ordering a first-order determinant of welfare, and schedulers that buffer transactions over short windows act as coordination mechanisms that stabilize competitive outcomes. In these environments, batching transitions from a redistributive policy to a welfare-improving execution rule, capable of strictly Pareto-dominating streaming execution over large regions of the preference space.
No single scheduler is therefore welfare-optimal across all environments. Scheduler design cannot be evaluated independently of the arrival regime and the dominant sources of loss faced by participants. Immediate execution is optimal when minimizing delay dominates welfare considerations; buffering becomes optimal when repeated competition makes ordering risk the primary welfare driver.
This conclusion closes the welfare analysis: scheduler choice is not a question of “better ordering” in the abstract, but of which execution externalities dominate under the prevailing competitive structure.
4. Parameter-Space Regions of FixedBatch Dominance
The welfare analysis in Section 3 established that scheduler optimality depends on the arrival regime. Under independent arrivals, streaming execution minimizes aggregate welfare loss, while under systematic, time-coupled competition, batching can strictly dominate streaming by stabilizing execution races. However, these results do not by themselves answer a more granular design question: for which classes of agent preferences does batching become strictly welfare-improving?
To address this, we perform a parameter-space dominance analysis. Rather than averaging welfare outcomes across heterogeneous environments, we ask whether FixedBatch Pareto-dominates alternative schedulers for specific preference profiles, and how the size and structure of this dominance region depend on the batch window.
We fix the execution environment and arrival process as in Section 3.4, focusing on the triggered-competition regime that induces systematic contention between agents. For each batch window size, we sample a high-dimensional space of agent preference profiles, varying sensitivities to:
execution delay
transaction fees (priority)
execution deadlines
tail risk
and relative ordering (race outcomes).
For each sampled profile, we compute per-agent welfare under Streaming, FixedBatch, and WaitUpTo, and evaluate Pareto dominance using the criteria defined in Section 3.
The first structural result is that the dominance region of FixedBatch expands monotonically with the batch window. For very small windows (on the order of 10–20 ms), FixedBatch Pareto-dominates alternative schedulers only for a negligible fraction of preference profiles. As the batch window increases to intermediate values (50–100 ms), the fraction of profiles for which FixedBatch strictly dominates grows substantially. Beyond this range, further increases in the batch window yield diminishing returns: the dominance region does not expand materially when moving from 100 ms to 200 ms, see from Fig. E1 to Fig. E5 in Appendix E.
Crucially, even at large batch sizes, dominance never becomes universal. FixedBatch improves welfare only on specific regions of the preference space, while other regions remain either streaming-dominant or Pareto-incomparable. This confirms that batching is not a generic improvement, but a regime- and preference-dependent design choice.
4.1 Structure of Dominant Preference Profiles
Figure 10 should be read as a preference-space diagnostic, rather than as a classification of concrete agent types. Each point corresponds to a single sampled preference profile, defined by a specific combination of sensitivities to execution delay, transaction fees, deadlines, tail risk, and relative ordering. For each profile, we compute the induced loss under Streaming, FixedBatch, and WaitUpTo scheduling, and evaluate whether FixedBatch Pareto-dominates the alternatives under the criteria defined in Section 3.
Fig. 10: Pairwise projections of sampled loss parameters for user agents comparing FixedBatch(100ms) with Streaming and WaitUpto(300ms). Blue points denote agent preference profiles where FixedBatch(100ms) dominates alternative schedulers in social welfare; grey points denote non-dominant profiles.
A blue point therefore indicates a preference profile for which FixedBatch yields strictly lower welfare loss than both Streaming and WaitUpTo under the same execution environment. Grey points indicate profiles for which FixedBatch is either Pareto-dominated or Pareto-incomparable. The figure does not encode the magnitude of welfare improvement, only whether a strict improvement occurs.
The purpose of the figure is to identify regions of the preference space for which batching improves welfare under the assumed loss model. Interpretation proceeds by examining where blue points concentrate and which combinations of sensitivities are associated with FixedBatch dominance.
Two robust patterns emerge.
First, FixedBatch dominates for profiles with low sensitivity to relative execution order and high sensitivity to transaction fees. In the corresponding panels of Fig. 10, blue points appear predominantly when priority sensitivity is large, even when ordering sensitivity is close to zero. This indicates that batching improves welfare for agents whose losses are driven primarily by fee expenditure rather than by execution order. For these profiles, the additional latency introduced by batching is economically insignificant, while the reduction in fee competition yields a net welfare gain.
Second, FixedBatch also dominates for profiles with high sensitivity to relative execution order and low sensitivity to transaction fees. In this region, welfare losses are dominated by execution races rather than by fees. Small, noisy arrival-time differences translate into large losses under streaming execution. By aggregating transactions over short windows, batching dampens this sensitivity to micro-timing noise, stabilizing execution outcomes and yielding strict Pareto improvements.
These two regions correspond to distinct mechanisms through which batching improves welfare: fee smoothing in the first case, and race stabilization in the second. Importantly, they do not define exclusive agent categories. Rather, they identify directions in preference space along which batching mitigates the dominant source of loss.
In contrast, preference profiles characterized by high deadline sensitivity and tight execution deadlines rarely fall within the FixedBatch dominance region. For such profiles, absolute timeliness is binding: execution delay cannot be traded off against lower fees or reduced ordering noise. In these regimes, the buffering intrinsic to batching directly translates into welfare loss, overwhelming any coordination benefits. As a result, deadline-driven workloads remain structurally misaligned with batching, even under systematic competition.
4.2 What Batching Changes (and What It Cannot)
Batching improves welfare only when it reduces the main source of loss experienced by agents:
If agents mainly lose welfare because of fee competition or execution races, batching helps by making execution less sensitive to small differences in priority bids or arrival times
If agents mainly lose welfare because of delay itself, batching hurts by adding latency that cannot be compensated elsewhere.
In other words, batching helps when welfare is dominated by relative effects (who goes first, how much is paid), and fails when welfare is dominated by absolute timing (how fast execution happens).
This is why batching can strictly improve welfare in race-driven or fee-sensitive environments, but is structurally incompatible with deadline-driven workloads, where any additional delay directly translates into loss.
Batching is therefore not a general improvement to execution quality, but a targeted mechanism that is beneficial only when it suppresses the dominant source of welfare loss.
Appendix
A1. Scheduler Footrule Distance
For a block containing N non-vote transactions, define:
prioi: the rank of transaction i when transactions are sorted by priority per compute unit,
rni: the rank of the same transaction in the actual execution order.
We define the Spearman footrule distance between these two permutations:
This quantity measures the total displacement, in rank space, between the realized execution order and the ideal priority-sorted order.
Since the raw footrule distance scales as O(N2), it is not directly comparable across blocks of different sizes. Its maximum value over all permutations is:
and we therefore introduce the normalized scheduler footrule distance
which constitutes a block-size invariant with
D = 0: realized order equals priority order exactly
D = 1: realized order is maximally anti-correlated with priority (reverse order)
intermediate values quantify partial deviation.
A1.1. Expected value under a random-permutation null
In our framework, if i ∈ 𝓘 = {1, …, n} is the index of the transaction ordered by priority and σ(i) ∈ 𝓘 = {1, …, n} is its permutation to reflect execution, we can write the Spearman’s Footrule metric as
Given the fact that for each i, \sigma(i) can be any of the \{1,\ldots,n\} with probability 1/n - given the random permutation assumption - we have
At this point, since when i = jthe sum is null and when i < jit is equal to the sum when j < i(due to the absolute value) we have that
From the equality
it follows
At this point, breaking the sum we get
Dividing by Smaxand sending N → ∞ we get the expected value of the Scheduler Footrule Distance in the case of random permutations
B1. The Scheduler Footrule Distance under High workload
During the March–April 2025 period, blocks on the Solana network were, on average, consistently full and exhibited limited variability in total compute usage, as documented in the analysis by Chorus One.
Focusing on the window from March 23rd to April 3rd, we observe that the distribution of the scheduler footrule distance D remains centered close to the random-permutation baseline (D ≃ 2⁄3), indicating that, at a network-wide level, transaction ordering was still largely dominated by arrival-time effects.
Fig.B1: Distribution of the scheduler footrule distance for the entire Solana network from March 23rd to April 3rd 2025. Source https://dune.com/queries/6364939/10123516
At the same time, the distribution exhibits a pronounced left tail, corresponding to blocks in which the realized execution order is substantially closer to priority ordering. Unlike later periods, this left tail does not develop into a secondary peak, which is consistent with the relatively small fraction of stake running Firedancer during this time window.
Importantly, this behaviour emerges despite the fact that blocks were already saturated in terms of compute units, ruling out explanations based on variable block fullness or unused capacity.
This interpretation is further supported by the absence of any statistically meaningful correlation between the scheduler footrule distance D and total compute units consumed per block. As shown in Fig. B2, blocks spanning the full range of compute usage exhibit similar values of D, indicating that deviations from random ordering are not explained by variations in CU load.
Taken together, these observations suggest that the long-left tail in the D distribution reflects scheduler-level effects, rather than block-level resource constraints.
C1. Relation to PoH-tick–level metrics
An important aspect of the scheduler footrule distance D is that it implicitly integrates information contained in lower-level timing metrics, such as transactions per PoH tick, while remaining directly grounded in on-chain execution order.
Schedulers that operate on rigid tick-based execution models — such as those that collect transactions externally (e.g., from a block builder) and execute them wholesale within predefined PoH ticks — may appear highly structured when viewed through tick-level metrics alone. However, such metrics do not capture how priority information is reflected in the realized execution order once order-flow variability and conflict constraints are taken into account.
By construction, Dmeasures the deviation between priority ordering and actual execution, independently of how transactions are grouped temporally at the PoH level. As a result, schedulers that execute all transactions within a fixed tick (as in harmonic or builder-driven designs) can still exhibit D distributions that resemble those of more adaptive or state-dependent schedulers, depending on how priority and conflicts are resolved in practice.
In this sense, the scheduler footrule distance captures the effective on-chain behaviour arising from the interaction of order-flow and scheduler logic, rather than the nominal structure imposed by tick-level execution. This makes D particularly suitable for comparing heterogeneous scheduler designs on equal footing and for identifying adaptive behaviours that are not directly visible from timing metrics alone.
D1. Agent Loss Function and Preference Heterogeneity
This appendix provides the formal specification of the agent-level loss functions used in Section 3. The purpose of this construction is to map execution timing and ordering outcomes into agent-specific disutility in a flexible but tractable way.
Throughout, the scheduler is treated as value-neutral: it determines when transactions execute and in what order. Losses arise only once these outcomes are evaluated through agent preferences.
Each agenti is assigned a per-block loss function composed of three classes of disutility:
Priority cost: Execution timing is not exogenous. Agents can attempt to obtain earlier execution by bidding higher priority, which directly increases their fees. In our model, a transaction submitted by agent i carries a priority bid bᵢ > 0, and the agent incurs a fee disutility proportional to the bid,
where αᵢ ≥ 0 represents the agent’s marginal sensitivity to fee expenditure. The scheduler affects welfare because it governs the extent to which higher bids actually translate into improved execution: under strong priority enforcement, increasing bᵢ reliably advances execution rank, whereas under arrival-dominated execution the same payment may yield little or no advantage.
A retail user submitting occasional swaps may have a large αᵢ, reflecting higher sensitivity fees.
A professional application (e.g., a market maker or oracle) may have a small αᵢ, treating fees as an operational cost necessary to maintain execution quality.
Delay-related losses: Execution delay induces disutility through three channels: baseline latency sensitivity, deadline penalties, and tail-risk aversion. We group these components into a single delay-related loss term
Baseline delay sensitivity: The simplest source of disutility is delay. Some agents are relatively insensitive to execution time within a slot, while others experience rapidly increasing loss as execution is delayed. We model this through a linear delay term,
where βᵢ ≥ 0 controls the agent’s sensitivity to execution latency, and Δti represents the difference between execution time and transaction generation time.
A retail user submitting a swap with wide slippage tolerance may have a small βi.
A latency-sensitive application, such as a pricing oracle or routing service, may have a much larger βi.
Deadline sensitivity (soft deadlines): Many agents face timing constraints beyond which execution remains possible but increasingly undesirable (e.g., stale prices or violated risk bounds). We model this with a one-sided penalty,
where diis the agent’s deadline and γᵢ ≥ 0 controls the severity of lateness.
A casual user may have a small γᵢ, tolerating late execution with modest degradation.
A risk-sensitive application may have a large γᵢ approximating “execute or fail” behaviour.
Tail-risk aversion: Two schedulers may yield similar average delays but differ substantially in their tail behaviour. Some agents are particularly sensitive to rare but severe delays. We capture this via an excess-delay penalty applied beyond a high quantile τ,
An infrastructure application that must maintain predictable performance may have a large δᵢ.
A non-urgent user may have δᵢ ∼ 0, caring little about rare execution outliers.
Relative ordering (execution race): Because user and application transactions touch the same state account, welfare may depend on which executes first when both are simultaneously runnable. We model this with a simple ordering penalty,
where j < i means agent jtransaction comes before agentitransaction.
A user trading against on-chain liquidity may prefer the application to execute first (small ki).
A liquidation bot incur loss if competitors act first (large ki).
E1. Parameter-Space Regions of FixedBatch Dominance
Fig. E1: Pairwise projections of sampled loss parameters for user agents comparing FixedBatch(200ms) with Streaming and WaitUpto(300ms). Blue points denote agent preference profiles where FixedBatch(200ms) dominates alternative schedulers in social welfare; grey points denote non-dominant profiles.
Fig. E2: Pairwise projections of sampled loss parameters for user agents comparing FixedBatch(100ms) with Streaming and WaitUpto(300ms). Blue points denote agent preference profiles where FixedBatch(100ms) dominates alternative schedulers in social welfare; grey points denote non-dominant profiles.
Fig. E3: Pairwise projections of sampled loss parameters for user agents comparing FixedBatch(50ms) with Streaming and WaitUpto(300ms). Blue points denote agent preference profiles where FixedBatch(50ms) dominates alternative schedulers in social welfare; grey points denote non-dominant profiles.
Fig. E4: Pairwise projections of sampled loss parameters for user agents comparing FixedBatch(20ms) with Streaming and WaitUpto(300ms). Blue points denote agent preference profiles where FixedBatch(20ms) dominates alternative schedulers in social welfare; grey points denote non-dominant profiles.
Fig. E5: Pairwise projections of sampled loss parameters for user agents comparing FixedBatch(10ms) with Streaming and WaitUpto(300ms). Blue points denote agent preference profiles where FixedBatch(10ms) dominates alternative schedulers in social welfare; grey points denote non-dominant profiles.
Solana’s Internet Capital Markets vision depends on execution quality, the same metric that defines competitiveness in TradFi, measured through effective spreads and adverse selection.
TradFi wholesalers such as Citadel and Virtu typically deliver sub-1 bps spreads on liquid large caps and single-digit bps on mid-caps.
On Solana, classic AMMs (Orca, Raydium, Meteora) deliver 5-9 bps on SOL and 8-10 bps on BTC for small clips, but spreads widen quickly with size due to fee tiers and liquidity depth.
Prop AMMs (Humidifi, SolFi, Tessera, Zerofi) behave like on-chain market makers, quoting sub-1-5 bps on SOL, 2-4 bps on BTC, and sub-20 bps on TRUMP.
For sub-$100k trades, Solana’s leading prop AMMs now match TradFi execution quality. The remaining gaps at larger sizes reflect balance-sheet scale, not microstructure limitations.
With prop AMMs setting quotes and aggregators optimizing routing, Solana is already delivering pockets of TradFi-grade execution. It’s an early step toward the Internet Capital Markets vision.
Introduction
In The Road to Internet Capital Markets, core Solana contributors outline a vision in which the network becomes the venue for global asset trading, defined by best prices and deepest liquidity. The main claim is that decentralized markets can absorb information from anywhere in the world in near real time. With Solana’s planned multi-leader architecture, or multiple block producers operating in parallel, the network can, in principle, reflect region-specific news faster than geographically concentrated TradFi venues.
While Solana can offer a global latency advantage, speed alone is not sufficient for market dominance. What ultimately determines competitiveness is execution quality, the true cost of a trade relative to the asset’s fair price. Execution quality can be measured via:
Effective spread (what is the price for the taker).
Adverse selection (whether prices move against you immediately after execution).
Understanding these is essential because execution quality is fundamentally about market making. How liquidity is provided, how makers manage inventory, and how they protect themselves from informed flow. In TradFi, these mechanics are handled by wholesalers like Citadel and Virtu. On Solana, they are increasingly managed by proprietary AMMs (prop AMMs) that operate as onchain market makers.
This article gives a practical introduction to market making on Solana:
How execution quality is measured in TradFi (Rule 605).
How Solana AMMs, classic and prop, map onto those concepts.
What the current execution landscape onchain looks like.
Why Execution Quality Matters
Markets function only when participants can trade size with limited price impact. Liquidity depends on confidence. Market makers supply it by continuously quoting both sides, but they will only do so if they expect to survive contact with informed flow. When they’re repeatedly “picked off”, selling before prices rise or buying before they fall, they widen spreads or withdraw entirely.
Execution quality, therefore, is about building an environment where liquidity providers can quote tightly without being punished for doing so. This is why the ICM roadmap emphasizes mechanisms that protect market makers even if that slows price discovery.
A venue can be global, fast, and permissionless, but if execution is consistently worse than in TradFi, the ICM vision collapses. Conversely, if Solana can match or exceed TradFi’s execution quality, the case for permissionless global markets becomes irrefutable.
Execution quality is the determinant of market competitiveness. For retail, wider spreads led to worse fills, which in turn gave rise to Payment for Order Flow (PFOF) models such as Robinhood’s (Levy 2022). For institutions, a few basis points equate to millions in annual execution costs. In DeFi, wider spreads translate into higher swap costs and declining crypto user retention. Traders focus on venues where all-in execution costs are lowest and most predictable.
To understand how Solana can compete, we adopt a formal, data-driven framework. The global standard for measuring execution quality remains the one enforced by the U.S. SEC, codified in SEC Rule 605.
Execution Quality in TradFi
Market Structure Context
Modern U.S. equity markets are fragmented across exchanges, wholesalers, and alternative trading systems. The regulatory anchor is the National Best Bid and Offer (NBBO), which aggregates the tightest bids and asks from all lit exchanges at a given moment.
Retail investors rarely interact with those exchanges directly. Instead, their brokers (Robinhood, Schwab, Fidelity) route orders to wholesale market makers such as Citadel, Virtu, and Jane Street. These firms internalize the flow, providing price improvement relative to NBBO and, in return, paying the broker under PFOF arrangements. Market makers want to trade against retail because it is less informed, and they are willing to subsidize brokers to access that flow.
Institutional investors, by contrast, interact more often on exchanges or dark pools, where execution quality is worse, liquidity is thinner, adverse selection risk is higher, and spreads are wider, a structural disadvantage compared to wholesaler-handled retail flow (Zhu, 2014). This segmentation creates two very different execution experiences:
Retail: low (sometimes sub-basis point) costs on liquid names, hidden in the PFOF model.
Institutional: higher costs due to adverse selection, especially in mid- and small-cap stocks.
Measurement Framework (SEC Rule 605)
The SEC mandates monthly disclosures under Rule 605 to bring transparency into execution quality. These reports require wholesalers and exchanges to publish detailed statistics on how retail orders were executed.
These statistics include effective spread, which is a canonical metric, defined as twice the absolute difference between the execution price and the NBBO mid, expressed in basis points:
This measure is a round-trip comparable. The ×2 convention assumes that a one-way trade should be evaluated as half of a full buy-sell round trip.`
Rule 605 also reports realized spread, which compares the execution price to the midpoint shortly after execution. It measures adverse selection, or whether the price moved against the liquidity provider after filling the order:
Positive realized spreads imply the order flow was uninformed. Negative values mean the market maker was picked off, indicating toxic flow.
In this article, we will focus on presenting effective spreads.
Effective Spreads in U.S. Equities
To ground execution quality in data, we analyzed SEC Rule 605 reports across wholesalers and aggregated marketable orders to estimate effective spreads in basis points relative to traded notional size.
Source: SEC Rule 605 September 2025 filings Citadel, Virtu, Jane Street. Dune.
Figure 1: TradFi effective spreads (bps) vs. USD notional size
Execution quality in US equities scales sharply with both liquidity and trade size.
In benchmark stocks like SPY or AAPL, spreads remain below 1 bp even for multi-million-dollar trades.
As size increases, costs widen gradually into the 1–5 bp range in META, TSLA, and HOOD.
Thinner names, such as COIN, can exceed 10 bps for sub-million-dollar clips.
Spreads widen with trade size relative to available liquidity. In traditional markets, a price curve emerges organically from the balance between a market maker’s inventory constraints and the risk of trading against informed flow. Each incremental unit of size consumes balance sheet and increases adverse selection exposure, steepening the effective cost.
This behavior is not unique to TradFi. Onchain markets obey the same logic. Legacy AMMs aim to approximate this relationship mechanically by using deterministic pool curves rather than adaptive inventories. Prop AMMs on Solana, by contrast, collapse that abstraction entirely. They are market makers in the traditional sense, quoting prices based on inventory, risk, and order-flow information.
AMM Architecture on Solana
Classic AMMs
Classic AMMs, such as constant-product and concentrated liquidity, no longer dominate Solana’s volume, but they still underpin much of the onchain market structure. Their design remains the reference point for decentralized execution quality.
Constant-product AMMs distribute liquidity uniformly along the price curve, ensuring continuity but leaving most capital idle and spreads structurally wide. Concentrated liquidity AMMs address this inefficiency by allocating liquidity more tightly around the active price, improving capital efficiency and near-mid execution.
Prop AMMs
Proprietary automated market makers are a Solana-native innovation. They follow the same deterministic settlement rules as classic AMMs, but replace their curve-based pricing logic with model-based quoting.
Figure 2: Share of Solana DEX volume by pool type. Prop AMMs now account for roughly 65% of on-chain trading volume, surpassing traditional CLAMMs.
Instead of encoding liquidity as a fixed function of reserves, a prop AMM computes executable quotes from a live strategy that reflects inventory, volatility, and hedging across markets.
Structurally, a prop AMM behaves like an onchain quoting engine connected to an offchain risk model.
It holds a pool or vault of assets that represent its trading inventory.
The program queries a pricing model that determines the best bid and ask consistent with its current exposure.
These quotes are deterministic, fully auditable onchain, but they can change every block, allowing the AMM to adjust to market data in near-real time.
This design eliminates the inefficiency of passive CLAMMs, in which LPs continuously provide liquidity on both sides of a curve and incur impermanent loss.
Prop AMMs quote **when their internal model deems the trade safe or profitable. Pricing is rewritten after each fill, redrawing the curve around the new inventory position. As a result, execution quality depends on model precision, update latency, and inventory limits.
The rise of prop AMMs on Solana marks a transition from curve-based liquidity to TradFi-like quote-based execution, only without custodial intermediaries.
To evaluate Solana’s ICM vision, we adapt Rule 605's logic to on-chain data. DeFi lacks a true NBBO because AMMs do not publish standing bids and asks. Instead of quote-based spreads, we infer execution quality directly from realized trades.
We group all executions within the same Solana slot and compute volume-weighted average buy and sell prices for each venue. Their difference represents the realized bid–ask width implied by actual trading activity at that moment:
Equation 3: Effective spreads onchain
Aggregating these slot-level values into volume-weighted averages gives a venue-level execution metric directly comparable to TradFi spreads. While this diverges from the NBBO-based definition, which uses public quotes rather than trades, the underlying economic interpretation is the same: the round-trip cost of immediate liquidity.
This framework allows us to measure how efficiently Solana’s DeFi venues deliver execution, expressed in the same units used for equity markets. We apply it to both classic AMMs and proprietary AMMs.
SOL–USDC
SOL is the deepest and most competitive market on Solana, making it the clearest choice for comparing AMM designs. The market has become increasingly crowded, with multiple venues active across the entire size ladder. Humidifi leads with almost 65% of SOL–USDC volume recently.
Figure 3A. SOL–Stablecoin DEX volume by venue (Blockworks Research, 2025).
Execution on SOL–USDC is uniformly strong across all AMM types, but venue-specific patterns emerge when trades are grouped by notional size.
Across all trade sizes, from 100 USD up to 1M USD, prop AMMs (HumidiFi, Tessera, ZeroFi, SolFi, GoonFi) sit at the front of the spread distribution. Their defining feature is size invariance, meaning spreads barely change as trade size increases.
HumidiFi quotes 0.4–1.6 bps across nearly the entire size ladder, only increasing to 5 bps at $1M. Tessera and ZeroFi cluster in the 1.3–3 bps range, maintaining these results even at 100k.
Pop AMMs set the lowest spreads on Solana and remain stable at scale.
For the bulk of flow ($1k-50k), they converge to a 5-9 bps band.
Raydium: ~1.7-6.5 bps
Orca + Meteora: generally 7-9 bps
Beyond ~$100k, spreads begin drifting upward with Whirlpool and Meteora widening more sharply as trades cross bins or consume depth.
Large clips ($500k-1M) often push spreads into double digits.
Orca remains the dominant venue by volume across all buckets above $50k.
BTC-USDC
In 2025, BTC liquidity on Solana cycles through several venues. Orca leads for most of the year, typically handling the largest share of weekly volume. Meteora remains the main secondary venue, with a steady but smaller footprint. Prop AMMs begin to matter as the year progresses: SolFi and ZeroFi start taking meaningful share from mid-2025 onward, and Humidifi emerges later with growing market share.
Figure 3B: Bitcoin DEX volume by venue (Blockworks Research, 2025).
BTC execution mirrors the SOL patterns but with more noise due to thinner depth. Prop AMMs dominate the low end of spreads, while classic AMMs widen more quickly with size.
Humidifi is the only prop AMM with consistent BTC flow and quotes 2–4 bps across all trade sizes, with minimal size dependence.
SolFi shows thinner inventory:
6–12 bps for small trades
20–47 bps for $50k+ clips, reflecting a still-developing quoting model.
ZeroFi lands between the two, starting around 1–2 bps for small clips and rising into the 6–12 bps range for mid-sized trades.
Figure 4B: Effective spreads (bps) by trade-size bucket across BTC AMMs. Bubble area proportional to traded volume.
Classic AMMs remain less competitive compared to propAMMs on BTC:
Orca anchors BTC execution at ~8 bps for small and mid-sized trades, rising to 9–10 bps above $50k as size increases.
Meteora DLMM steepens quickly: 8–9 bps at $1k–$5k, but 15+ bps by ~$10k.
PancakeSwap posts 2–3 bps on small pools due to very low fees, though depth is shallow.
Overall, prop AMMs set the tightest BTC spreads, while classic AMMs account for most of the trading volume, but at higher and more size-sensitive costs.
TRUMP-USDC
TRUMP is a useful benchmark for meme execution. Its liquidity is large enough (including a ~$300M DLMM pool) to behave like a mid-cap, yet volatile enough to stress AMM pricing models. Spreads are an order of magnitude wider than in SOL or BTC, but the relative performance across AMM types remains informative.
Prop AMMs again show flexible but not dominant pricing:
Humidifi: 11–16 bps for mid-sized trades, slightly tighter at $10k–$50k
SolFi: occasionally efficient (~7 bps), but with high variance (20–26 bps)
Zerofi: stable performance at smaller sizes with 11–18 bps
Prop AMMs do not dominate TRUMP execution the way they do in SOL.
Figure 4C: Effective spreads (bps) by trade-size bucket across TRUMP AMMs. Bubble area proportional to traded volume.
Classic AMMs cover most TRUMP execution with Meteora quoting 20–25 bps across almost all sizes, a profile tied directly to its fee floor as trades stay within a single, huge liquidity bin of the aforementioned pool.
What the Data Shows
Execution quality on Solana is no longer constrained by AMM mechanics, but by balance-sheet scale and risk tolerance.
Classic AMMs behave as their design predicts. Fees and liquidity placement impose a spread floor, while limited depth causes execution costs to rise nonlinearly with trade size. Outside of SOL, these venues still carry most of the flow, but only by accepting higher and more size-sensitive execution costs.
Prop AMMs, by contrast, show the characteristics of true market makers. Their spreads are tighter and largely invariant to size across a wide range, showing that pricing is driven by inventory and risk limits rather than fixed curves.
This difference points to the remaining execution gap. Where Solana underperforms TradFi, the cause is primarily capital scale. TradFi wholesalers compress spreads at multi-million-dollar sizes by deploying massive balance sheets and internalizing flow across venues. On Solana, comparable execution quality already exists, but only up to the inventory limits of today’s prop AMMs.
With that framing, the implications for Solana’s Internet Capital Markets vision become clear.
Conclusion
Prop AMMs define the execution frontier. They deliver sub-1–5 bps spreads on SOL with minimal size dependence; on BTC, Humidifi anchors execution at 2–4 bps; and even on volatile tokens like TRUMP, prop AMMs are the only venues able to break below the 20–25 bps floor imposed by fees in substantial Meteora’s liquidity pools. Their performance comes from market-maker–style quoting: inventory-aware, model-driven, and updated on top of every block.
Classic AMMs show a more size-sensitive regime. SOL pairs cluster around 5–9 bps for typical flow; BTC spreads widen sharply at higher notionals; and TRUMP prices settle near the fee floor. They provide the liquidity backbone, but not the best execution.
Compared to TradFi, Solana is increasingly competitive for small and mid-sized orders.
Rule 605 data places S&P-500 names in the sub-1–8 bps range, mid-caps in the 3–25 bps range. Prop AMMs already match or exceed this for sub-$100k trades, especially in the native SOL markets. The remaining performance gap stems from scale: TradFi exchanges achieve execution quality even for orders of $ 1M+.
In short, prop AMMs have brought true market making on-chain. They have shown the path forward: a quote-driven, inventory-aware model that, when combined with increasingly sophisticated routing, will define how the Internet Capital Markets vision ultimately comes to fruition.
Over the past year, the role of the DeFi curator, once a niche function in lending markets, has evolved into one of the most systemically important positions in the on-chain economy. Curators now oversee billions in user capital, set risk parameters, design yield strategies, and determine what collateral is considered “safe.”
But DeFi learned an expensive lesson: many curators weren’t actually managing risk; they were cosplaying it.
A Balancer exploit, a cascading stablecoin collapse, and liquidity crises across top vaults forced the industry to confront an uncomfortable truth: the system worked as designed, but the people setting the guardrails did not.
The DeFi Curator Market Today
As DeFi evolves, risk management and capital efficiency are becoming modular and specialized functions. A new category of entities, called curators, now design and manage on-chain vaults, marking a major shift in liquidity management since automated market makers. The concept of the curator role was pioneered and formalized by Morpho, which externalized risk management from lending protocols and created an open market for curators specializing in vault strategy and risk optimization. This new standard has since been adopted across DeFi, making curators fundamental for managing vaults and optimizing risk-adjusted returns for depositors.
Core Responsibilities of Curators
A curator is a trusted, non-custodial strategist who builds, monitors, and optimizes on-chain vaults to deliver risk-adjusted yield for depositors. They design the rules, enforce the limits, and earn performance fees on positive results.
Here’s an overview of the core roles and activities associated with a curator:
Activities associated with a curator
Market Structure
The curator market in DeFi has rapidly grown from $300 million to $7 billion in less than a year, reflecting a 2,200% growth. This surge marks a key milestone in the development of risk-managed DeFi infrastructure. The increase is driven by new lending protocols adopting the vault architecture, institutional inflows, the rise of stablecoins, clearer regulations, and growing trust in curators like Stakehouse or Gauntlet.
While we’re still in the “wild west” era of DeFi as recent events have shown, curators are a first step to introduce more isolated and essential risk controls, making on-chain yields more predictable, compliant, and secure for users. This has also enabled companies to introduce “earn”-type of products to their users in a simplified way.
Key metrics:
Over half of the TVL value managed by curators is on Ethereum, reflecting its deep money market liquidity and continued DeFi dominance. Although still early, top curators have captured significant market share, with the top five controlling around 43%. Much of their success comes from their role on Morpho, while other protocols like Kamino v2 and Euler are still growing with similar models.
With recent events, the curators landscape got reshuffled a bit. Gauntlet took over the top spot from Steakhouse and is managing approximately $1.88 billion in TVL. Previously, Steakhouse’s focus on stablecoin-oriented strategies had allowed it to outpace competitors such as Gauntlet and MEV Capital. Steakhouse now manages $1.26 billion, and also holds a particularly strong position within Kamino on Solana, capturing 20% market share ($295M TVL), though it remains absent from restaking-focused protocols such as Symbiotic.
The business model of DeFi curators is primarily driven by performance fees, earned as a percentage of the yield or profits generated by the vaults they manage. This structure effectively aligns incentives, as curators are rewarded for optimizing returns while maintaining prudent risk management. Curators also work directly with B2B partners in building special-purpose vaults where pricing and revenue share is decided between the participating parties.
Some curators have adopted a 0% performance fee structure on their largest vaults to attract liquidity and strengthen brand recognition (for example, Steakhouse’s USDC vault). Current revenue data available on DeFiLlama provides a good indicator for assessing the earnings and relative performance of active curators.
DeFi’s Really, Really Bad Week
It began when Balancer v2 stable pools were exploited on November 3, 2025, with a precision rounding bug in the stable swap math that let an attacker drain about 130 million dollars. Seeing a near five year old, heavily audited protocol fail triggered a broad risk reset and reminded everyone that DeFi yield carries real contract risk. Around the same time, Stream Finance disclosed that an external fund manager had lost about 93 million dollars of platform assets. Stream froze deposits, and its staked stablecoin xUSD depegged violently toward 0.30 dollars.
xUSD was widely rehypothecated as collateral. Lenders and stablecoin issuers had lent against it or held it in backing portfolios, in some cases with highly concentrated exposure. When xUSD’s backing came into question, pegs had to be defended, positions were unwound, and exits were gated. What started as a few specific failures became a system wide scramble for liquidity, which is what eventually showed up to users as queues, withdrawal frictions, and elevated rates across curator vaults and lending protocols.
Liquidity Crunches on Vaults
We saw large liquidity crunches on Morpho after the xUSD / Stream Finance blowup. On Morpho, only one of roughly 320 MetaMorpho vaults (MEV Capital's) had direct exposure to xUSD, resulting in about $700,000 in bad debt. However, the shock raised ecosystem-wide risk aversion, with many lenders wanting to withdraw at once.
These liquidity crunches were mainly driven by simultaneous withdrawals colliding with Morpho's isolated-market design. MetaMorpho vaults like Steakhouse USDC aggregate UX, not liquidity. Each vault operates with isolated lending markets and no shared liquidity. Each market has a cap, a LTV limit, and a utilization level that tracks how much cash is already lent out.
When many depositors rushed to withdraw, the only immediately available cash was the idle balance in those specific markets. That idle cash got used up first, utilization hit 100%, and withdrawals moved into a queue. As utilization climbed, the interest rate curve ramped up, spiking as high as 190%, to incentivize borrowers to repay or get liquidated. While that released cash, it doesn't happen instantly. Borrowers need to source funds or liquidations need to clear. Until that flow returns cash to the vault's underlying markets, withdrawals remain slow because there is no shared pool to tap outside the vault's configured markets.
Crucially, even 'safe' USDC vaults without xUSD exposure, like those managed by Steakhouse or Gauntlet briefly became illiquid, out of caution rather than losses. The fragmented liquidity meant funds couldn't be pulled from some global pool, resulting in a classic timing mismatch: immediate redemption demand versus the time needed for borrowers to de-lever and for the vault to pull funds back from its underlying markets. Even so, these vaults recovered within hours, and overall, 80% of withdrawals were completed within three days.
As a random guy on Twitter pointedly said: “It appears that the Celsius/BlockFi’s of this cycle are DeFi protocols lending to vault managers disguised as risk curators”.
The incident demonstrated that Morpho's design worked as intended: isolation contained the damage to one vault, curator decisions limited broader exposure, and the system managed acute stress without breaking. However, it also revealed the tradeoff inherent in the design—localized liquidity can drain quickly even when actual losses are minimal and contained.
Protocol Design Choices (Aave vs Morpho)
Aave and Morpho both enable borrowing and lending, but they differ in how they manage risk and structure their markets.
With Aave, the protocol manages everything: which assets are available, the risk rules, and all market parameters. This makes Aave simple to use. Depositors provide capital to shared pools without making individual risk decisions. This setup ensures deep liquidity, fast borrowing, and broad asset support. However, this “one-size-fits-all” model means everyone shares the same risk. If Aave’s risk management or asset selection fails, all depositors may be affected, and users have limited ability to customize their risk exposure.
Morpho, on the other hand, decentralizes risk management by allowing independent curators (like Gauntlet or Steakhouse) to create specialized vaults. Each vault has its own risk parameters, such as different collateral requirements, liquidity limits, or liquidation rules. Lenders and borrowers choose which vaults to use based on their risk appetite. This provides much more flexibility, allowing users to select safer or riskier strategies.
However, this flexibility also leads to fragmented liquidity. Funds are spread across many vaults, and users must evaluate each vault’s risks before participating. For non-experts, this can be challenging, and it can occasionally result in lower liquidity or slower withdrawals during volatile market conditions.
What Should Have Been Done Differently?
While the Balancer hack is out of the control of any curator and was hard to foresee, xUSD is a different story. Basic risk hygiene would have gone a long way. If curators had treated xUSD as a risky credit instrument rather than “dollar-equivalent collateral,” most of the bad debt, queues, and forced deleveraging would have been materially smaller. Curators need to step their game up and there is a lot of room for improvement…
Future Directions and Market Gaps in the Curator Role
Over the coming years, resolving gaps in regulatory clarity, risk metrics, distribution access, and technical interoperability will transform curators from crypto-native specialists into fully licensed, ratings-driven infrastructure that channels institutional capital into on-chain yield with similar standards and scale of traditional asset managers.
Regulatory Landscape
The curator market currently operates in a regulatory grey area. Curators do not hold assets or control capital directly, but their work (configuring vaults and tracking performance) closely resembles activities of regulated investment firms/advisors. At the moment, none of the major curators are licensed. Yet to serve banks and RIAs, curators will need investment advisor registration, KYC capabilities, and institutional custody integration—the compliance stack that crypto-native players deliberately avoid.However, the market is slowly moving toward regulated infrastructure, as shown by Steakhouse’s partnership with Coinbase Institutional, the tokenized Treasury efforts of Ondo and Superstate or Société Générale announcing depositing into a Morpho. Under current U.S. and EU rules, curators who earn performance fees or promote yield-generating products may eventually fall under investment advisory regulations. This creates both a compliance risk and a first-mover opportunity: a regulated curator could define new governance standards, attract institutional investors, and speed up the market’s formalization.
No Unified Risk Framework
One gap in the DeFi curator market is the absence of a standardized risk taxonomy. Today, every curator invents its own subjective labels: “Prime”, “Core”, “High-Yield” or “Aggressive” with no shared definitions, no comparable metrics, and no regulatory acceptance. There have been attempts by a number of players, such as Exponential, Credora (acquired by Restone), and Synnax, to create a unified standard for risk ratings, but no universal standard has been accepted by the space yet.This fragmentation blocks advisors from building compliant portfolios and prevents institutions from scaling allocations. In traditional finance, the Big 3 credit rating agencies (Moody’s, S&P, Fitch) generate over $6 billion annually by applying universal, transparent ratings to $60 trillion in debt. DeFi needs the same: AAA/BBB ratings with hard rules on parameters such as collateral types, oracle design, initial and liquidatable LTVs, and liquidity thresholds.Without it, curated TVL stays siloed and institutional inflows can remain limited. The first player to deliver a Moody’s-grade rating with Standard labels, Transparent methodology and Regulatory acceptance has the opportunity to own the category and unlock the next $100 billion in advisor-driven deposits.
Distribution Remains Bottlenecked
The market is still bottlenecked by crypto-native brands. Curators like Steakhouse and MEV Capital dominate TVL with battle-tested strategies, but they lack the institutional credibility, regulatory wrappers, and advisor relationships that RIAs and private banks demand. This leaves billions in potential deposits stranded in wallets or CEXs, unable to flow seamlessly into curated vaults. In TradFi, asset managers like BlackRock route trillions through established RIA platforms, wealth desks, and brokerage channels. DeFi has not a lot of equivalents yet: The Coinbase x Morpho cbBTC partnership is the exception proving the rule, and shows early promising signs that with sufficient track record and credibility, institutions and platforms with distribution are willing to tap into DeFi-native strategies. When infrastructure connects, billions flow. We need more of it. Custodian APIs that let advisors allocate client funds on-chain, wealth platform integrations, etc. Société Générale's digital asset arm, SG-FORGE, selected Morpho specifically because its architecture solves the problem of finding a regulated, compliant counterparty for on-chain activities. The curator who can build the "click-through" infrastructure that turns any compliant vault into an advisor-native product will unlock the next $50 billion in institutional AUM.
Technical Fragmentation
DeFi curators face major technical fragmentation. Each platform (such as Morpho or Kamino) requires its own custom code, dashboards, and monitoring tools. Managing a single vault across multiple platforms means rebuilding everything from scratch, much like opening separate bank accounts with no shared infrastructure. This slows growth, increases costs, and limits scale. What's missing: one system to configure all vaults. Set position limits once, deploy to Morpho and Kamino automatically. Build for one platform, launch on ten.What the market needs is a unified engine that works across all platforms: configure it once, apply consistent rules, and manage every vault through the same system.
Conclusion
The recent failures proved two things simultaneously:
DeFi’s architecture is resilient: Isolation worked. Losses were contained. Liquidity returned. The system bent but did not break.
DeFi’s risk culture is not resilient: Curators mispriced collateral, mis-sized positions, and treated credit-like assets as stablecoins. The failures were not black swans, but predictable results of weak standards.
If curators want to handle institutional capital, they must evolve from clever yield optimizers into true risk managers with:
hard collateral constraints
standardized ratings
transparent reporting
institutional compliance
distribution-ready infrastructure
The next $50–$100B of on-chain yield will flow to curators who look less like DeFi power users and more like regulated asset managers. Conservative risk frameworks. Scalable distribution. Institutional compliance.
The curator role isn't disappearing. It's professionalizing.


.png)
.png)
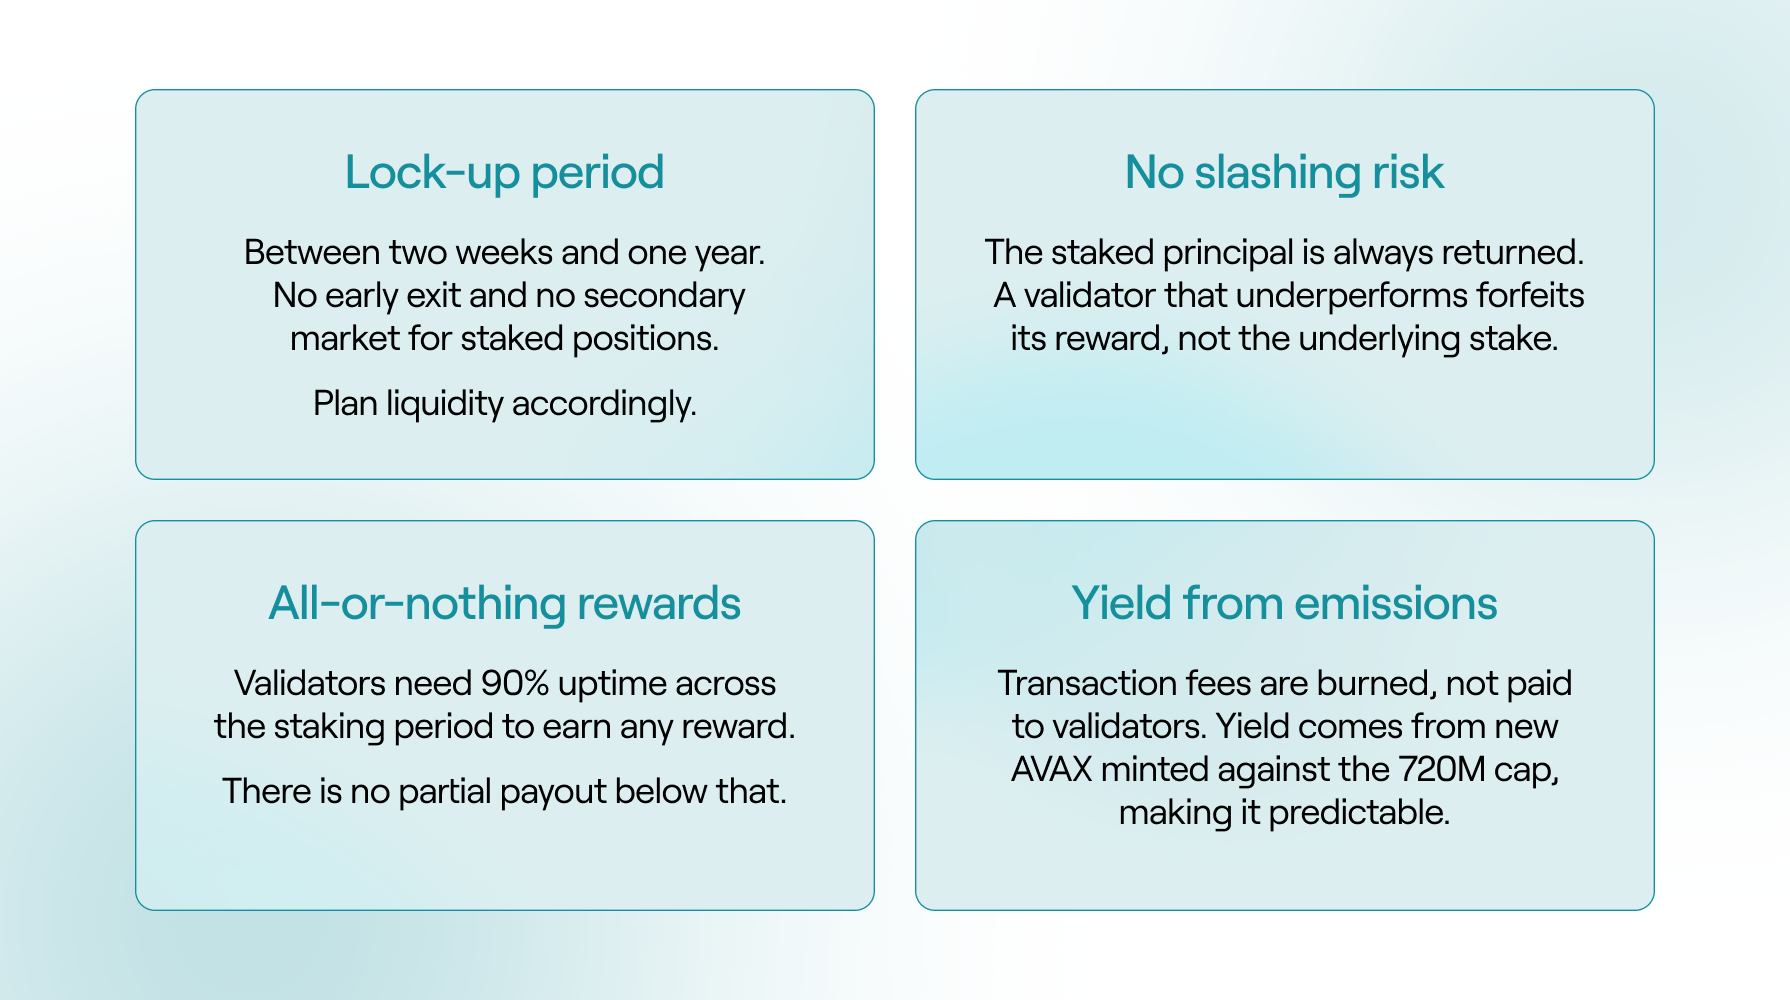
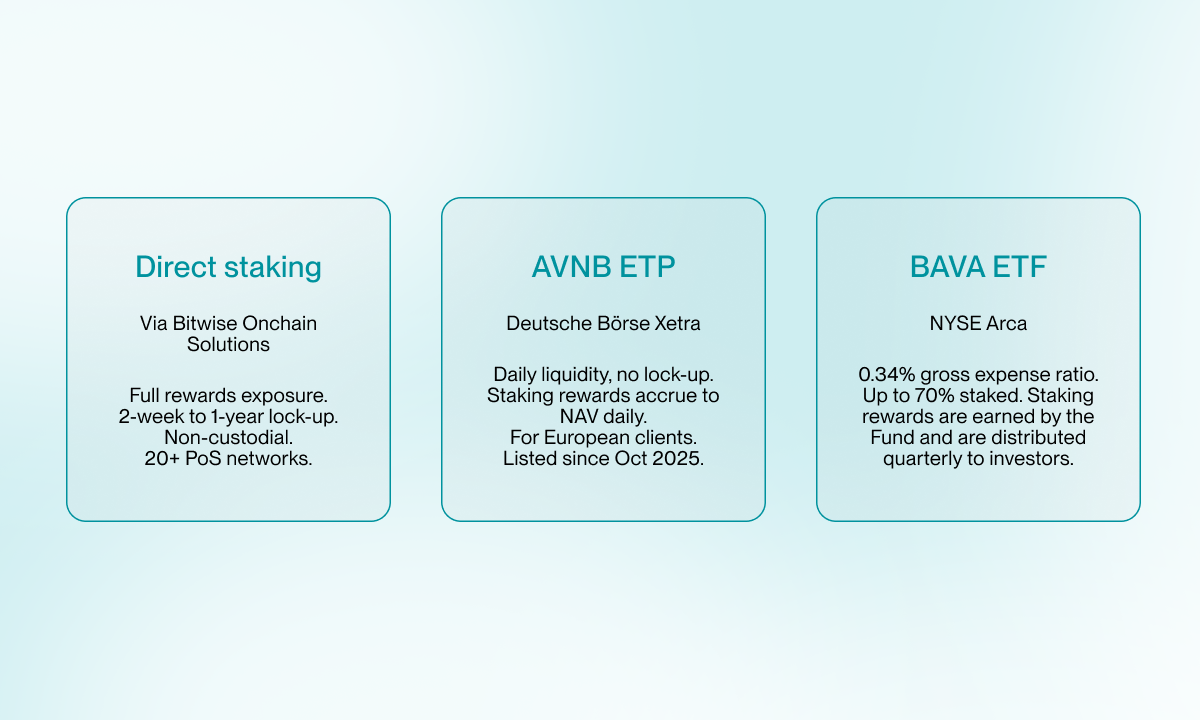
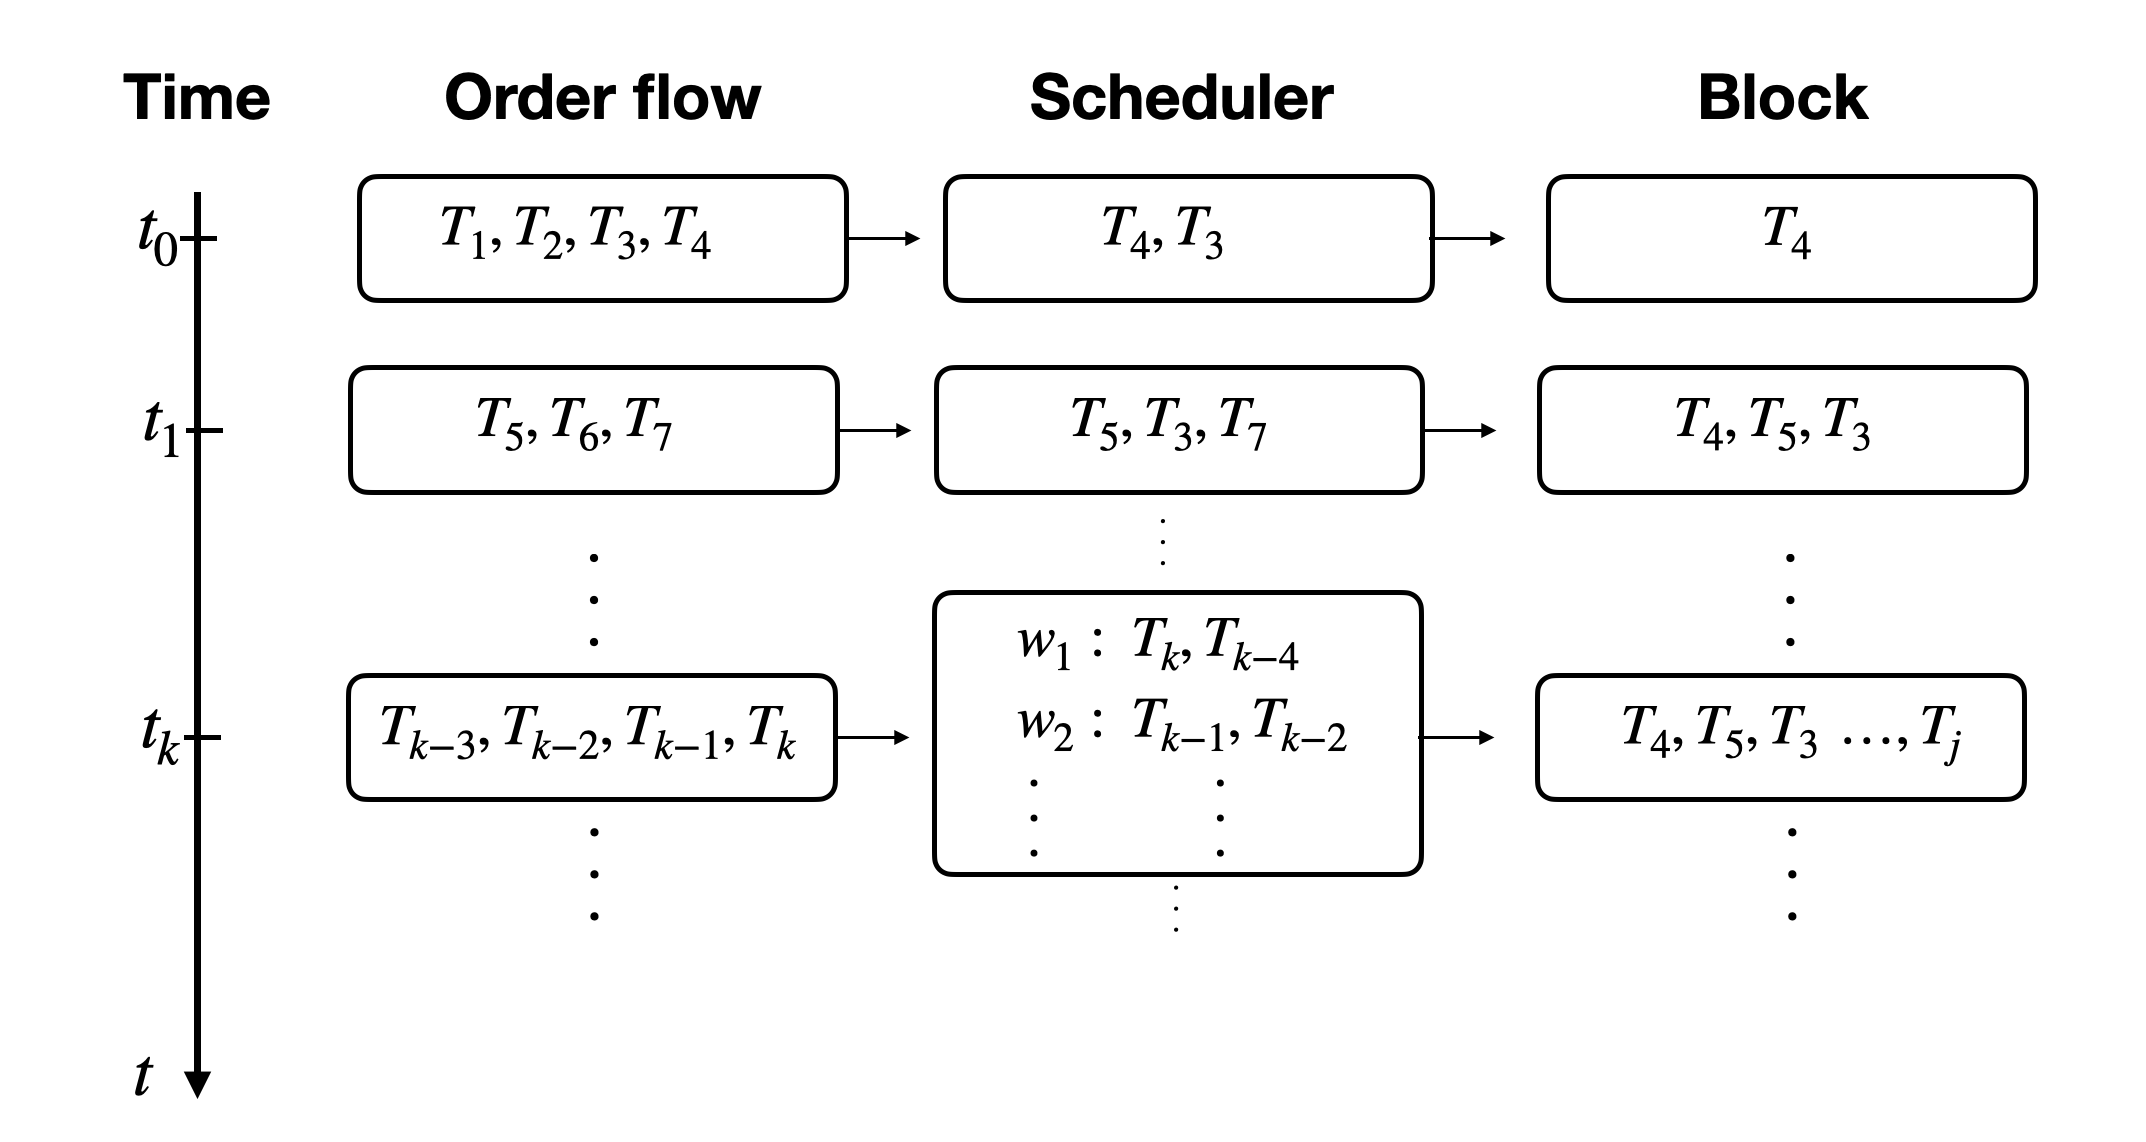

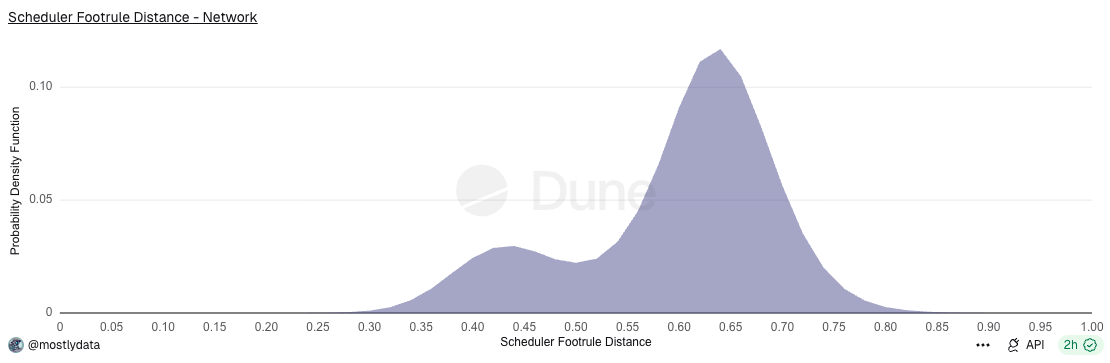

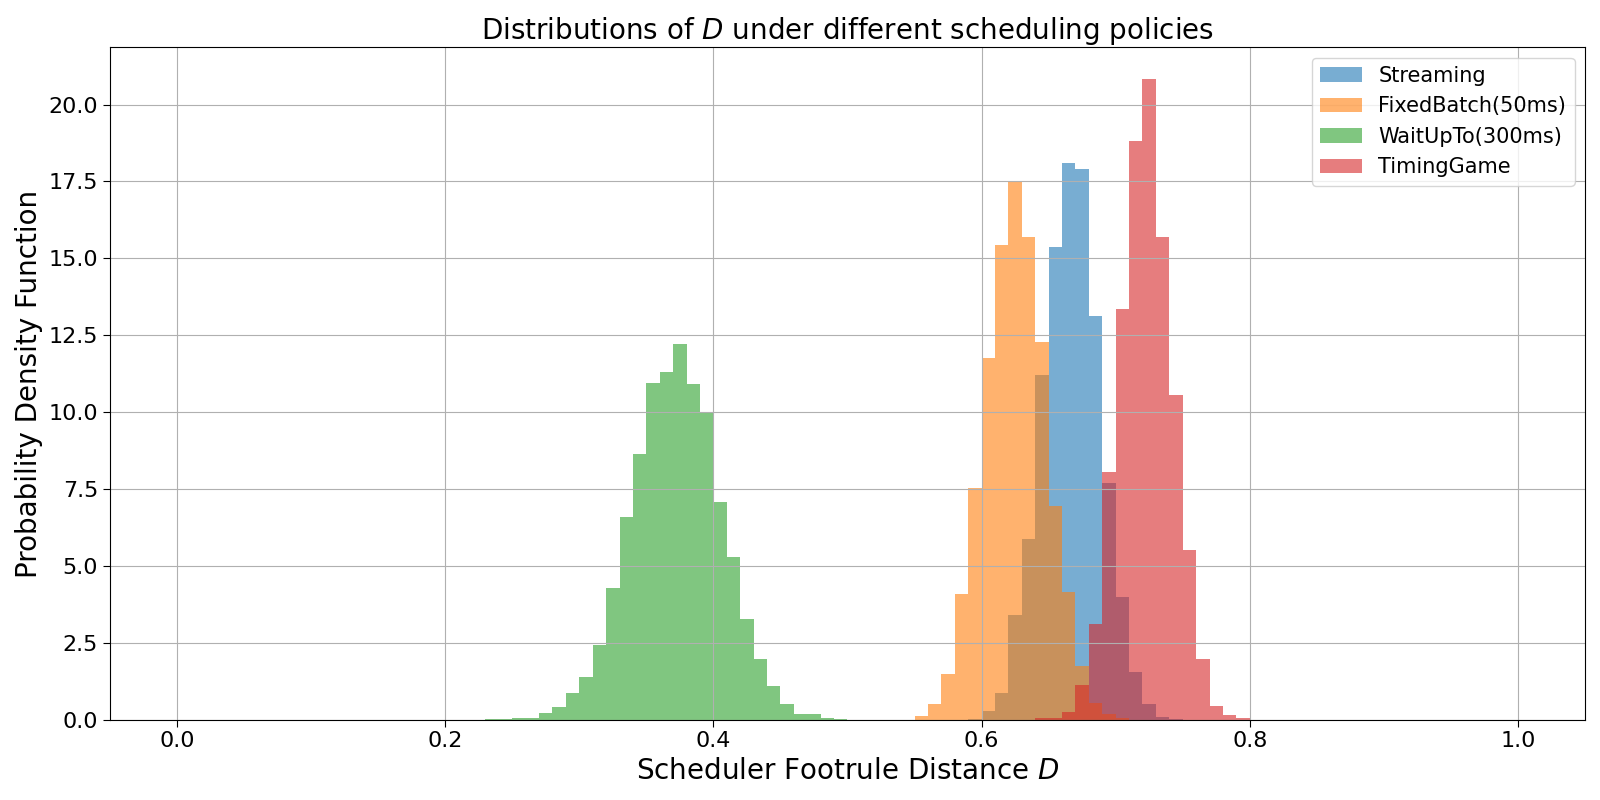
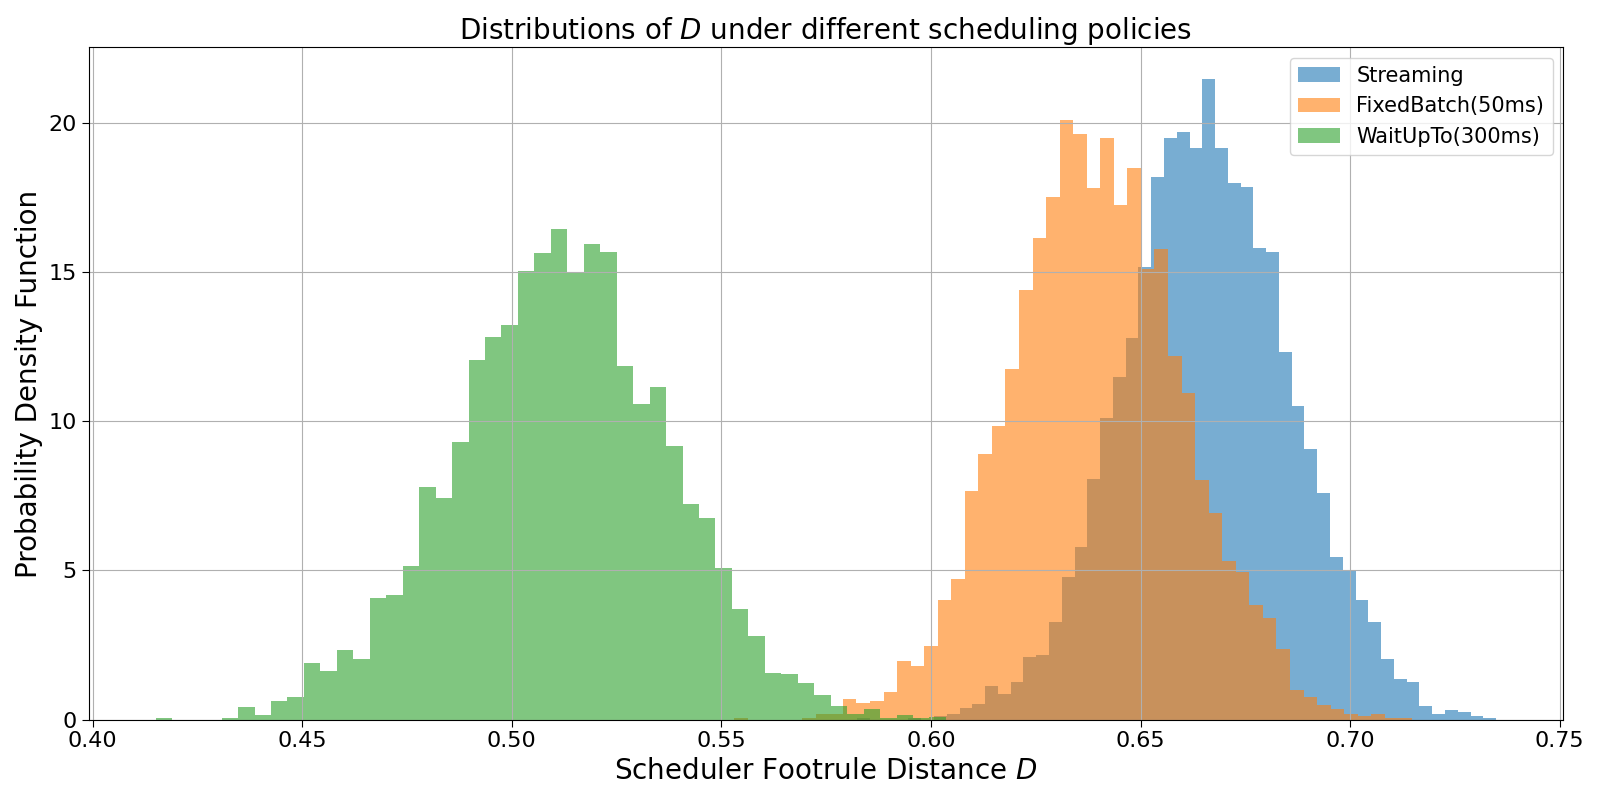


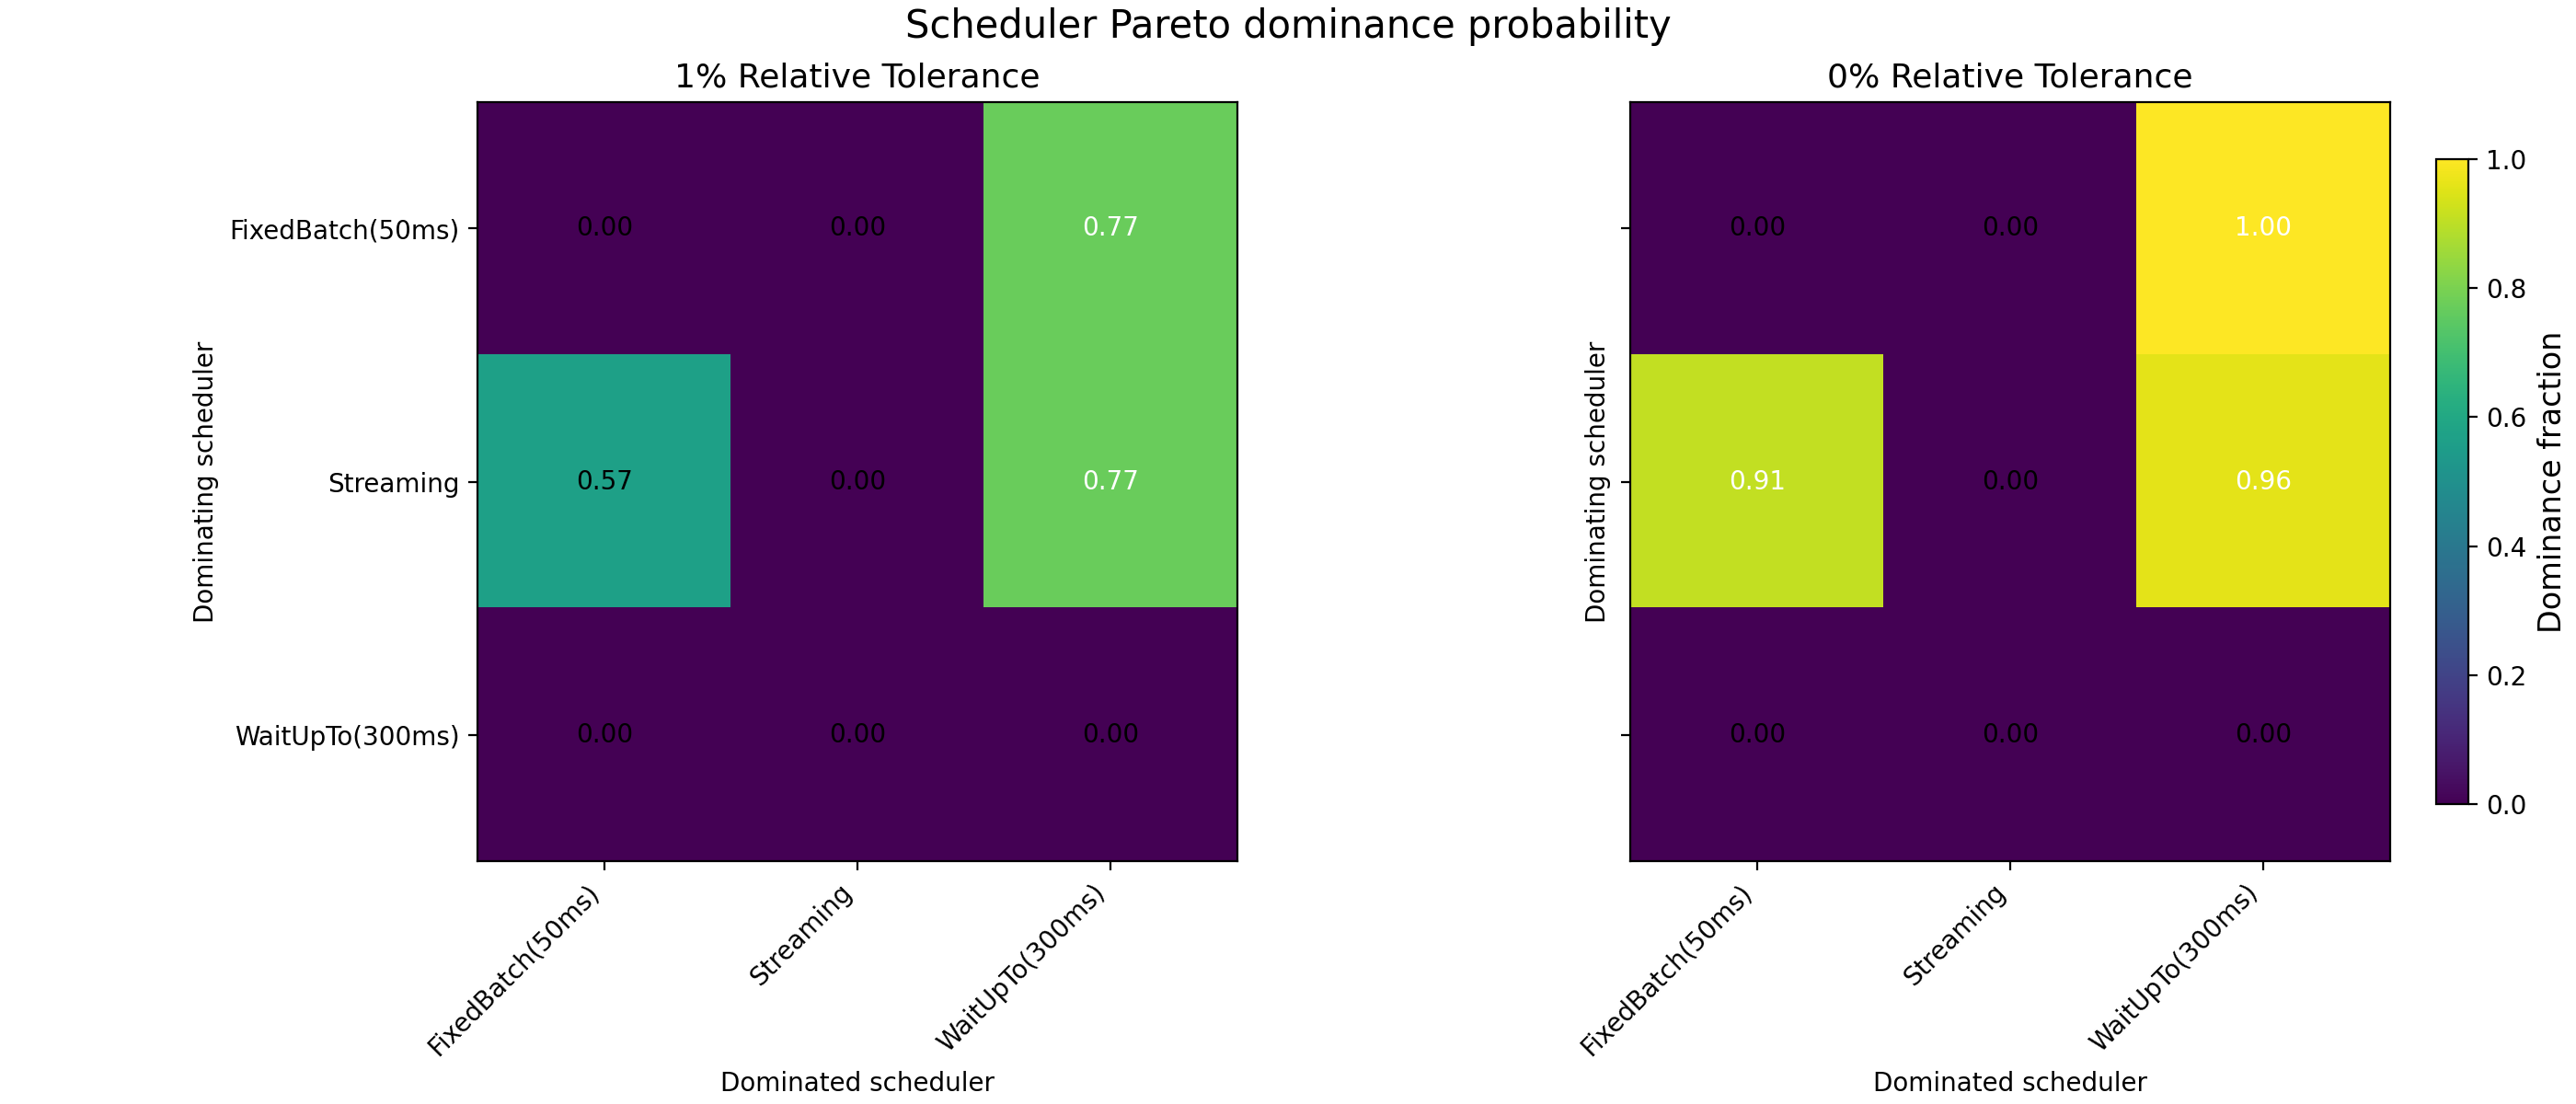
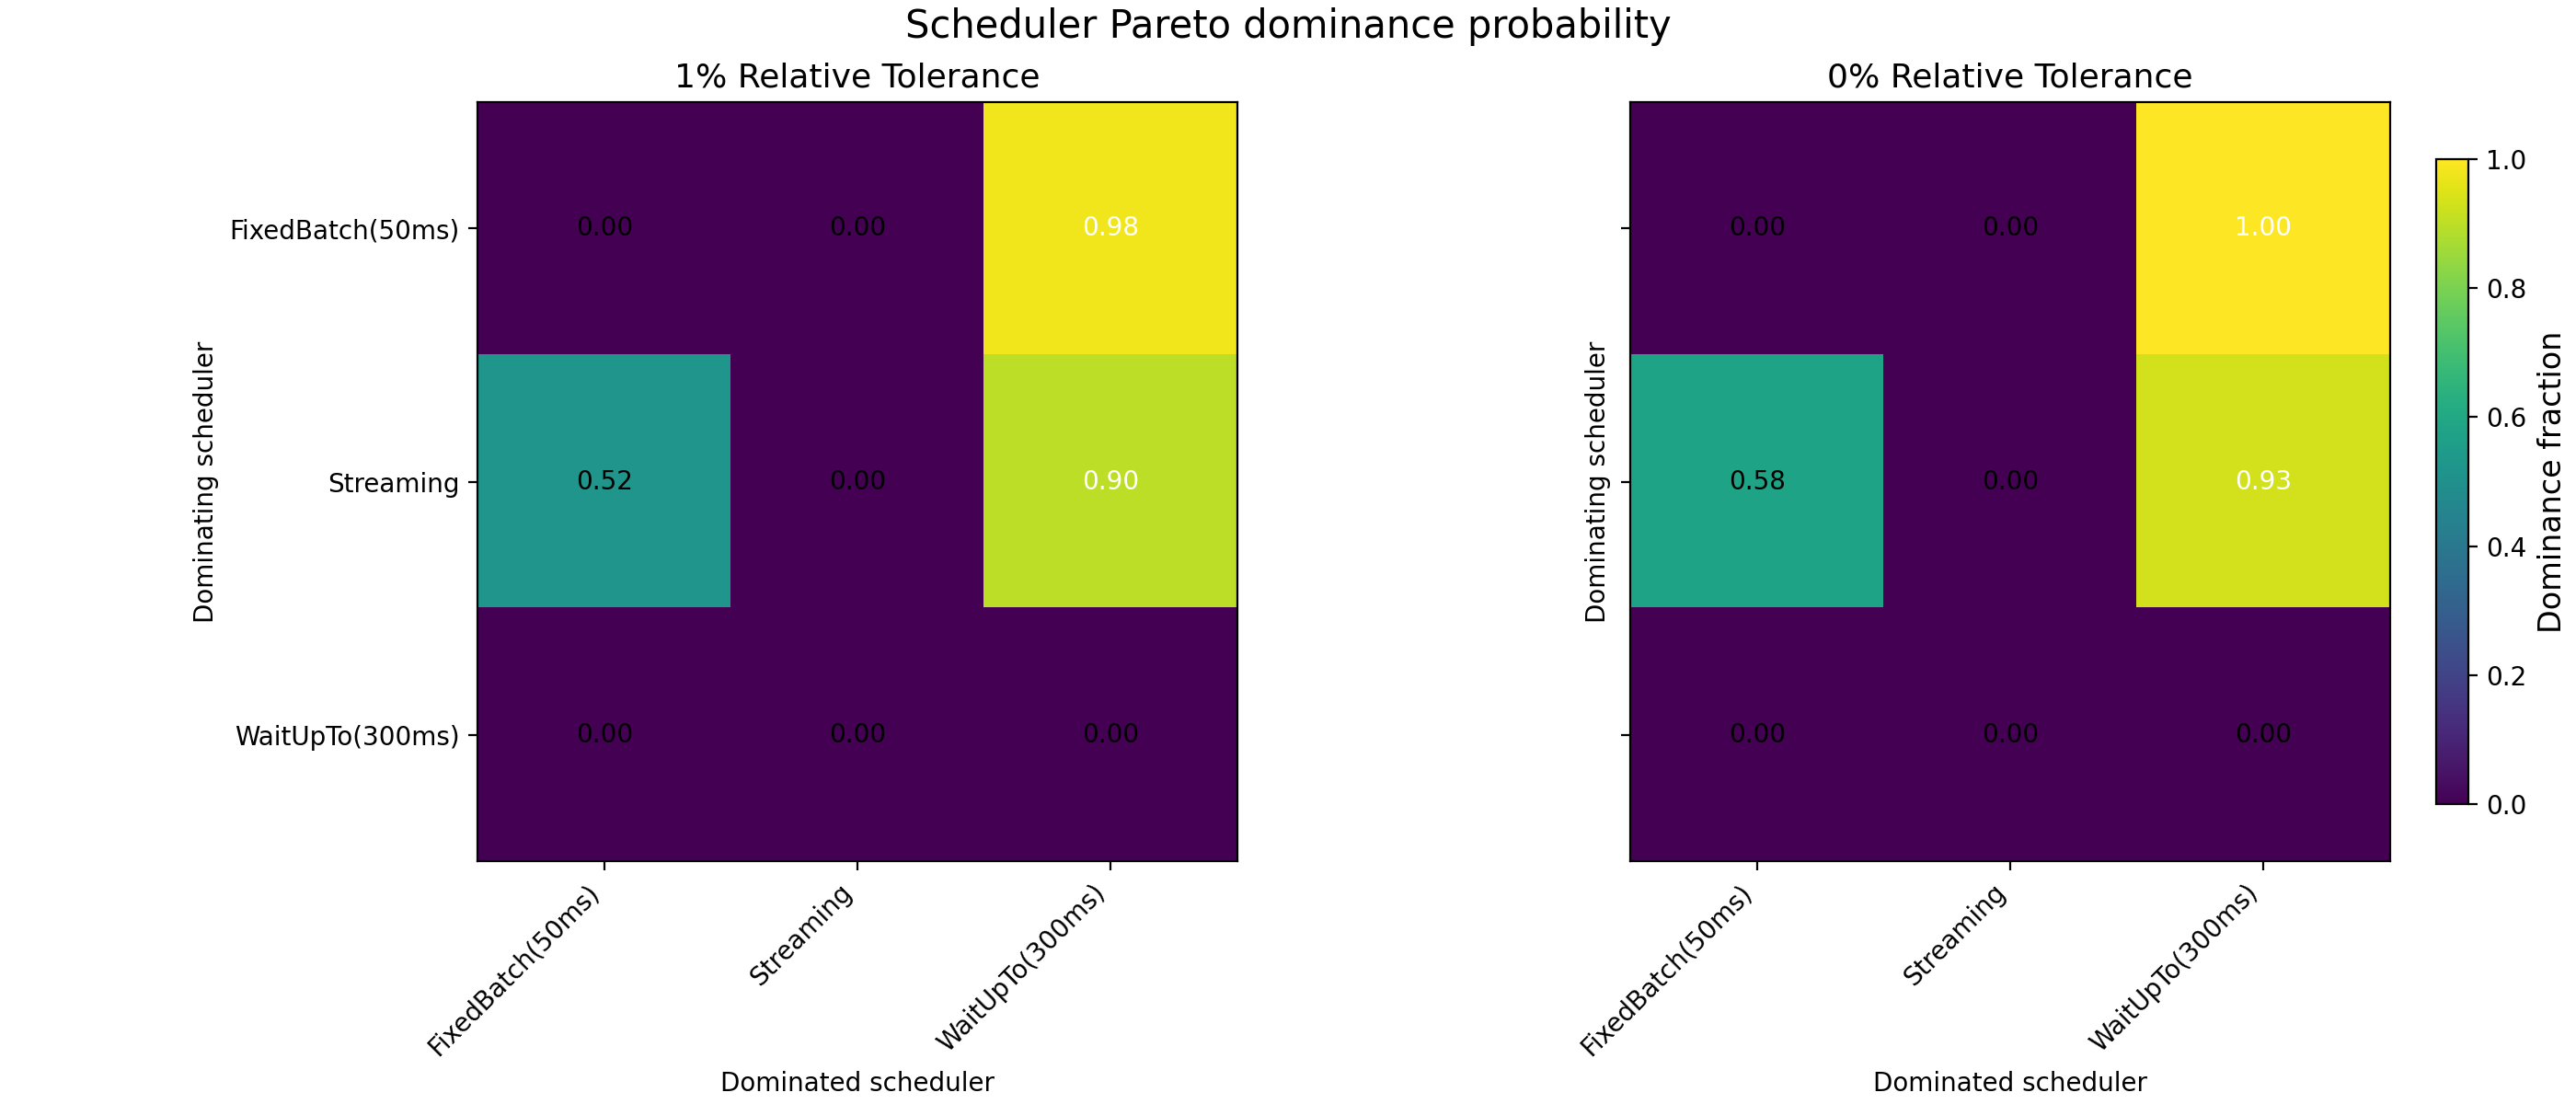


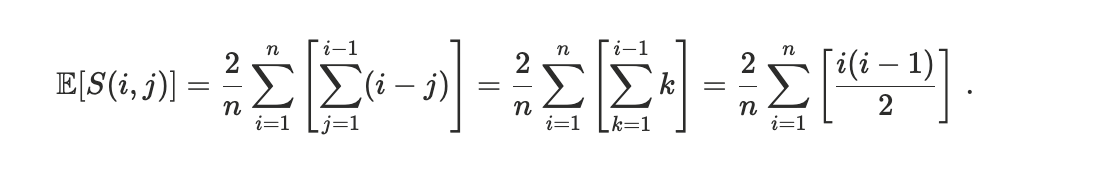


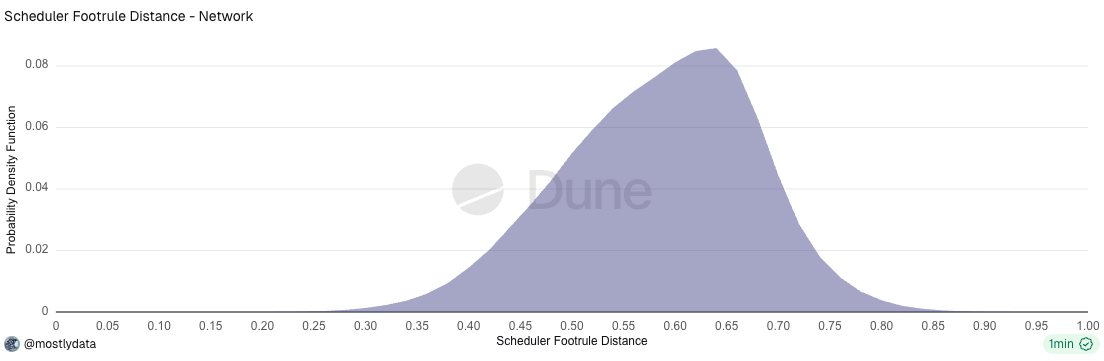
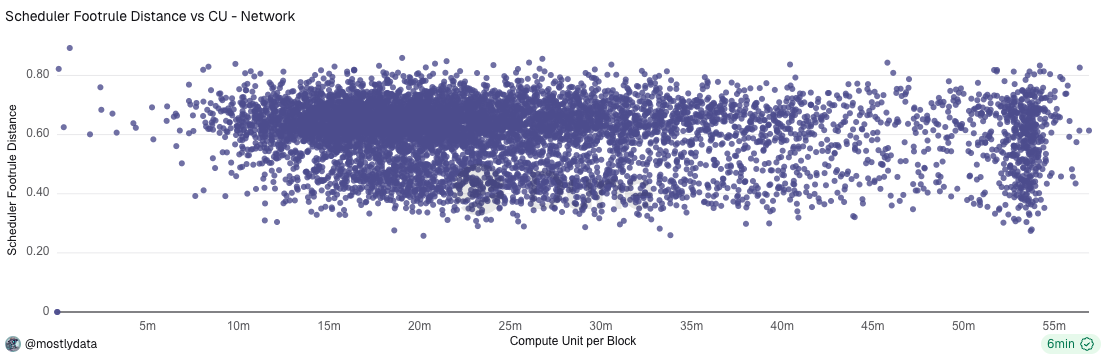


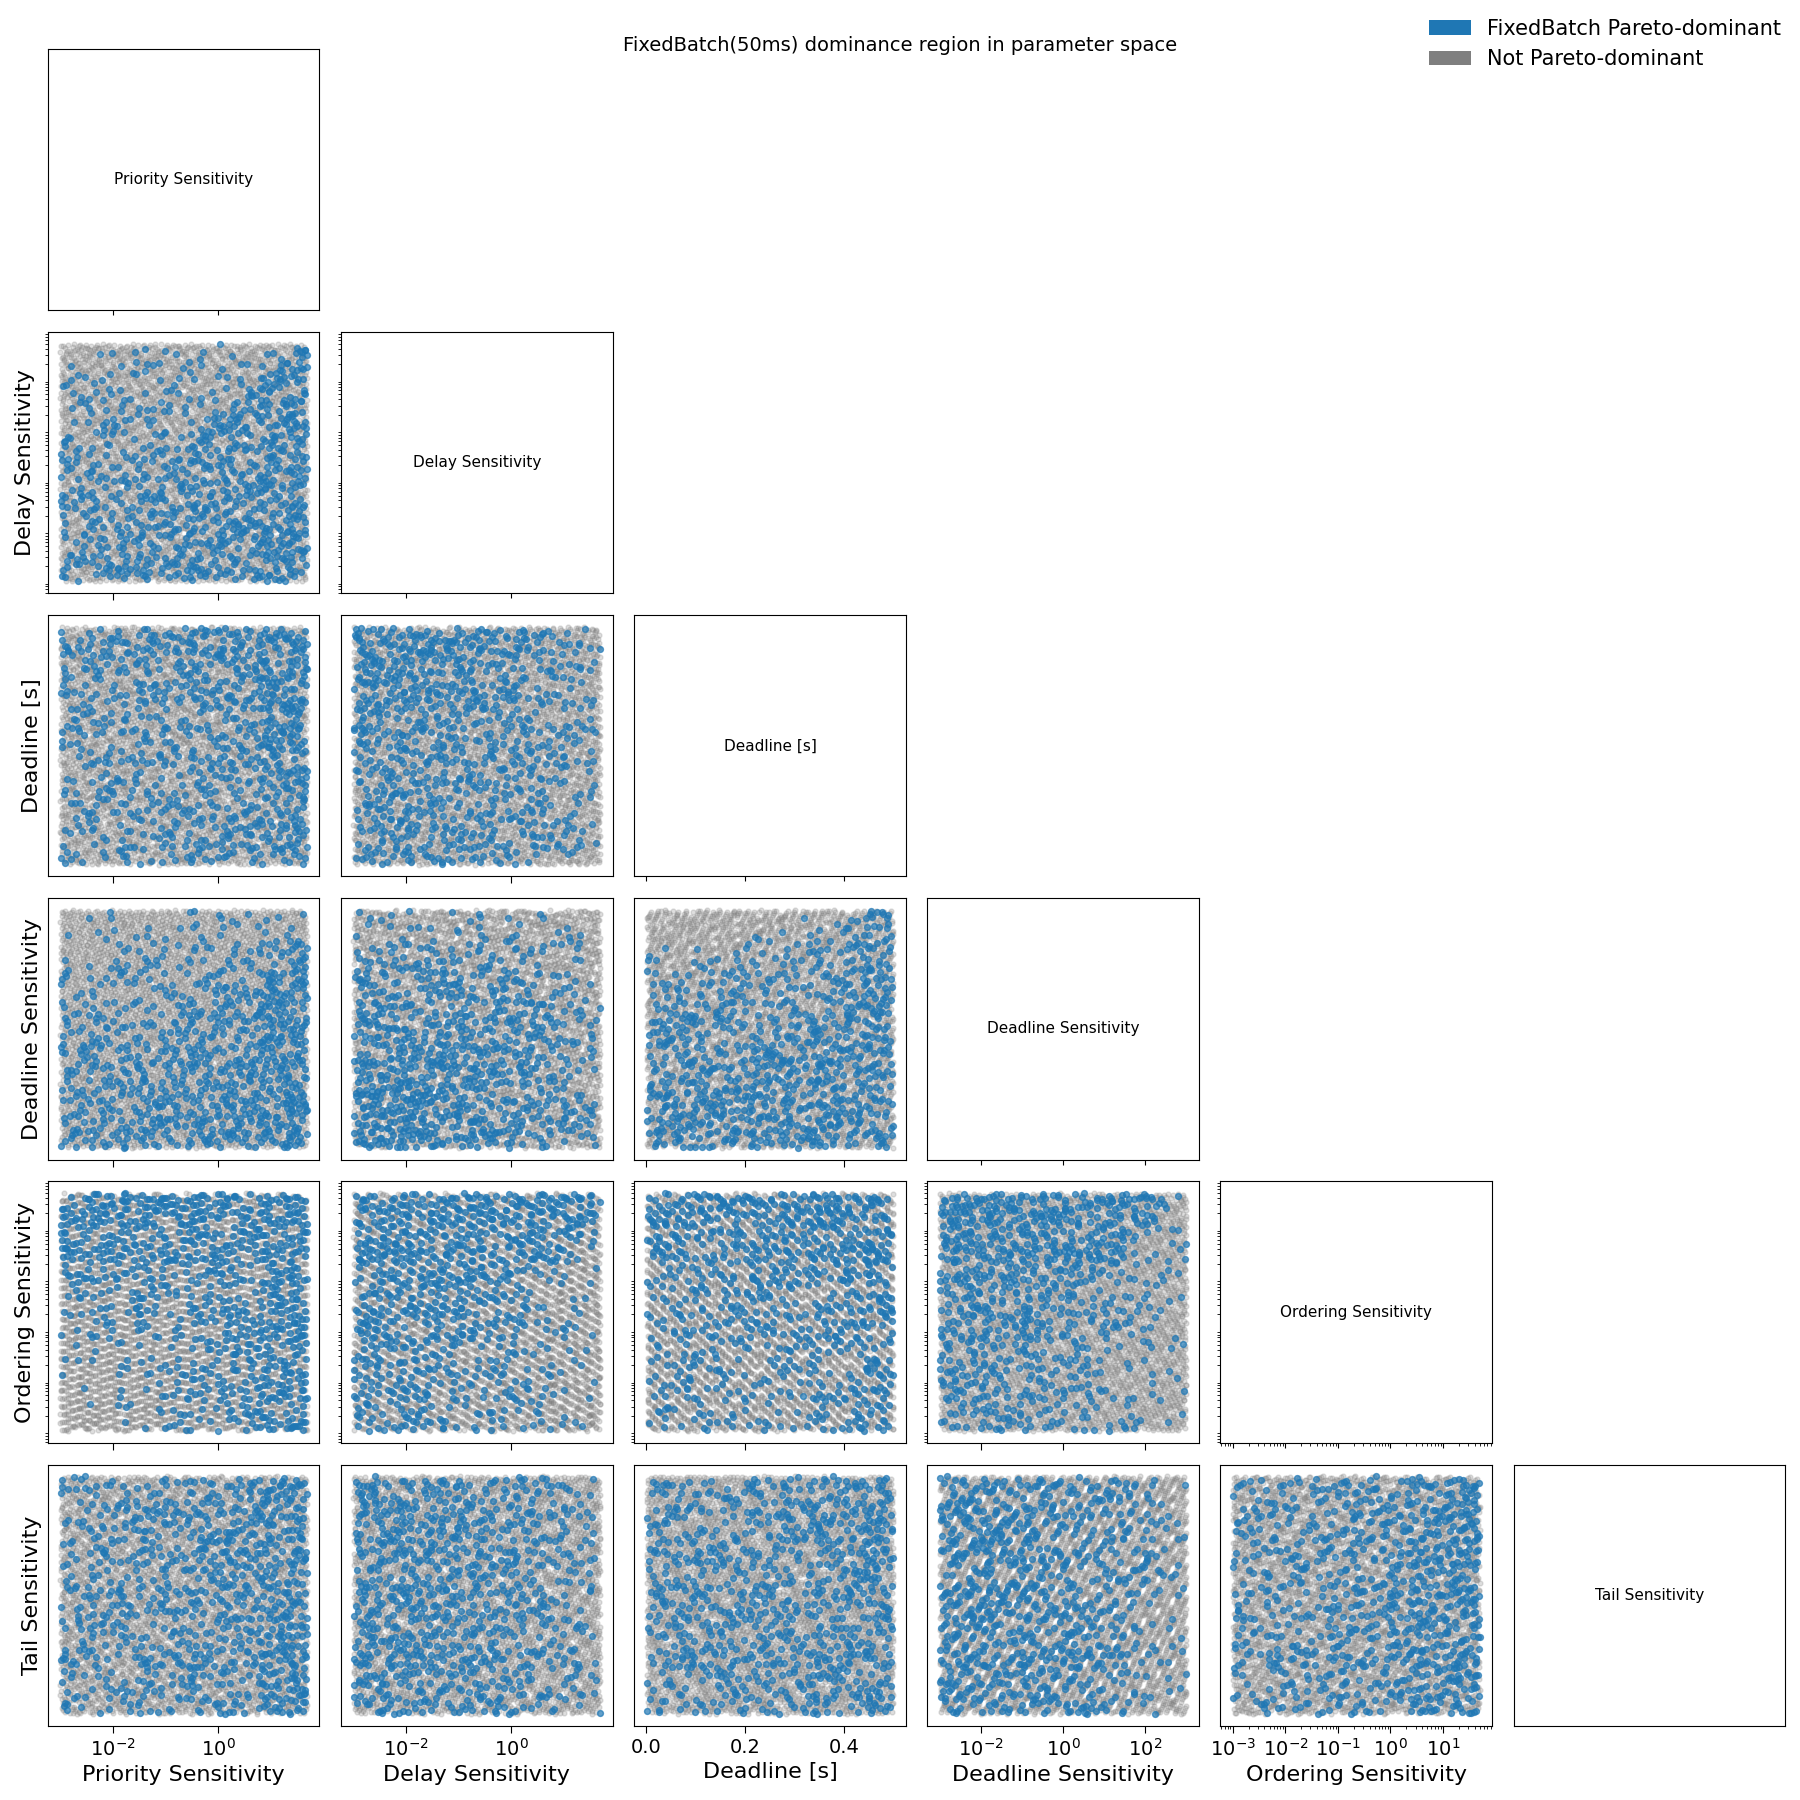
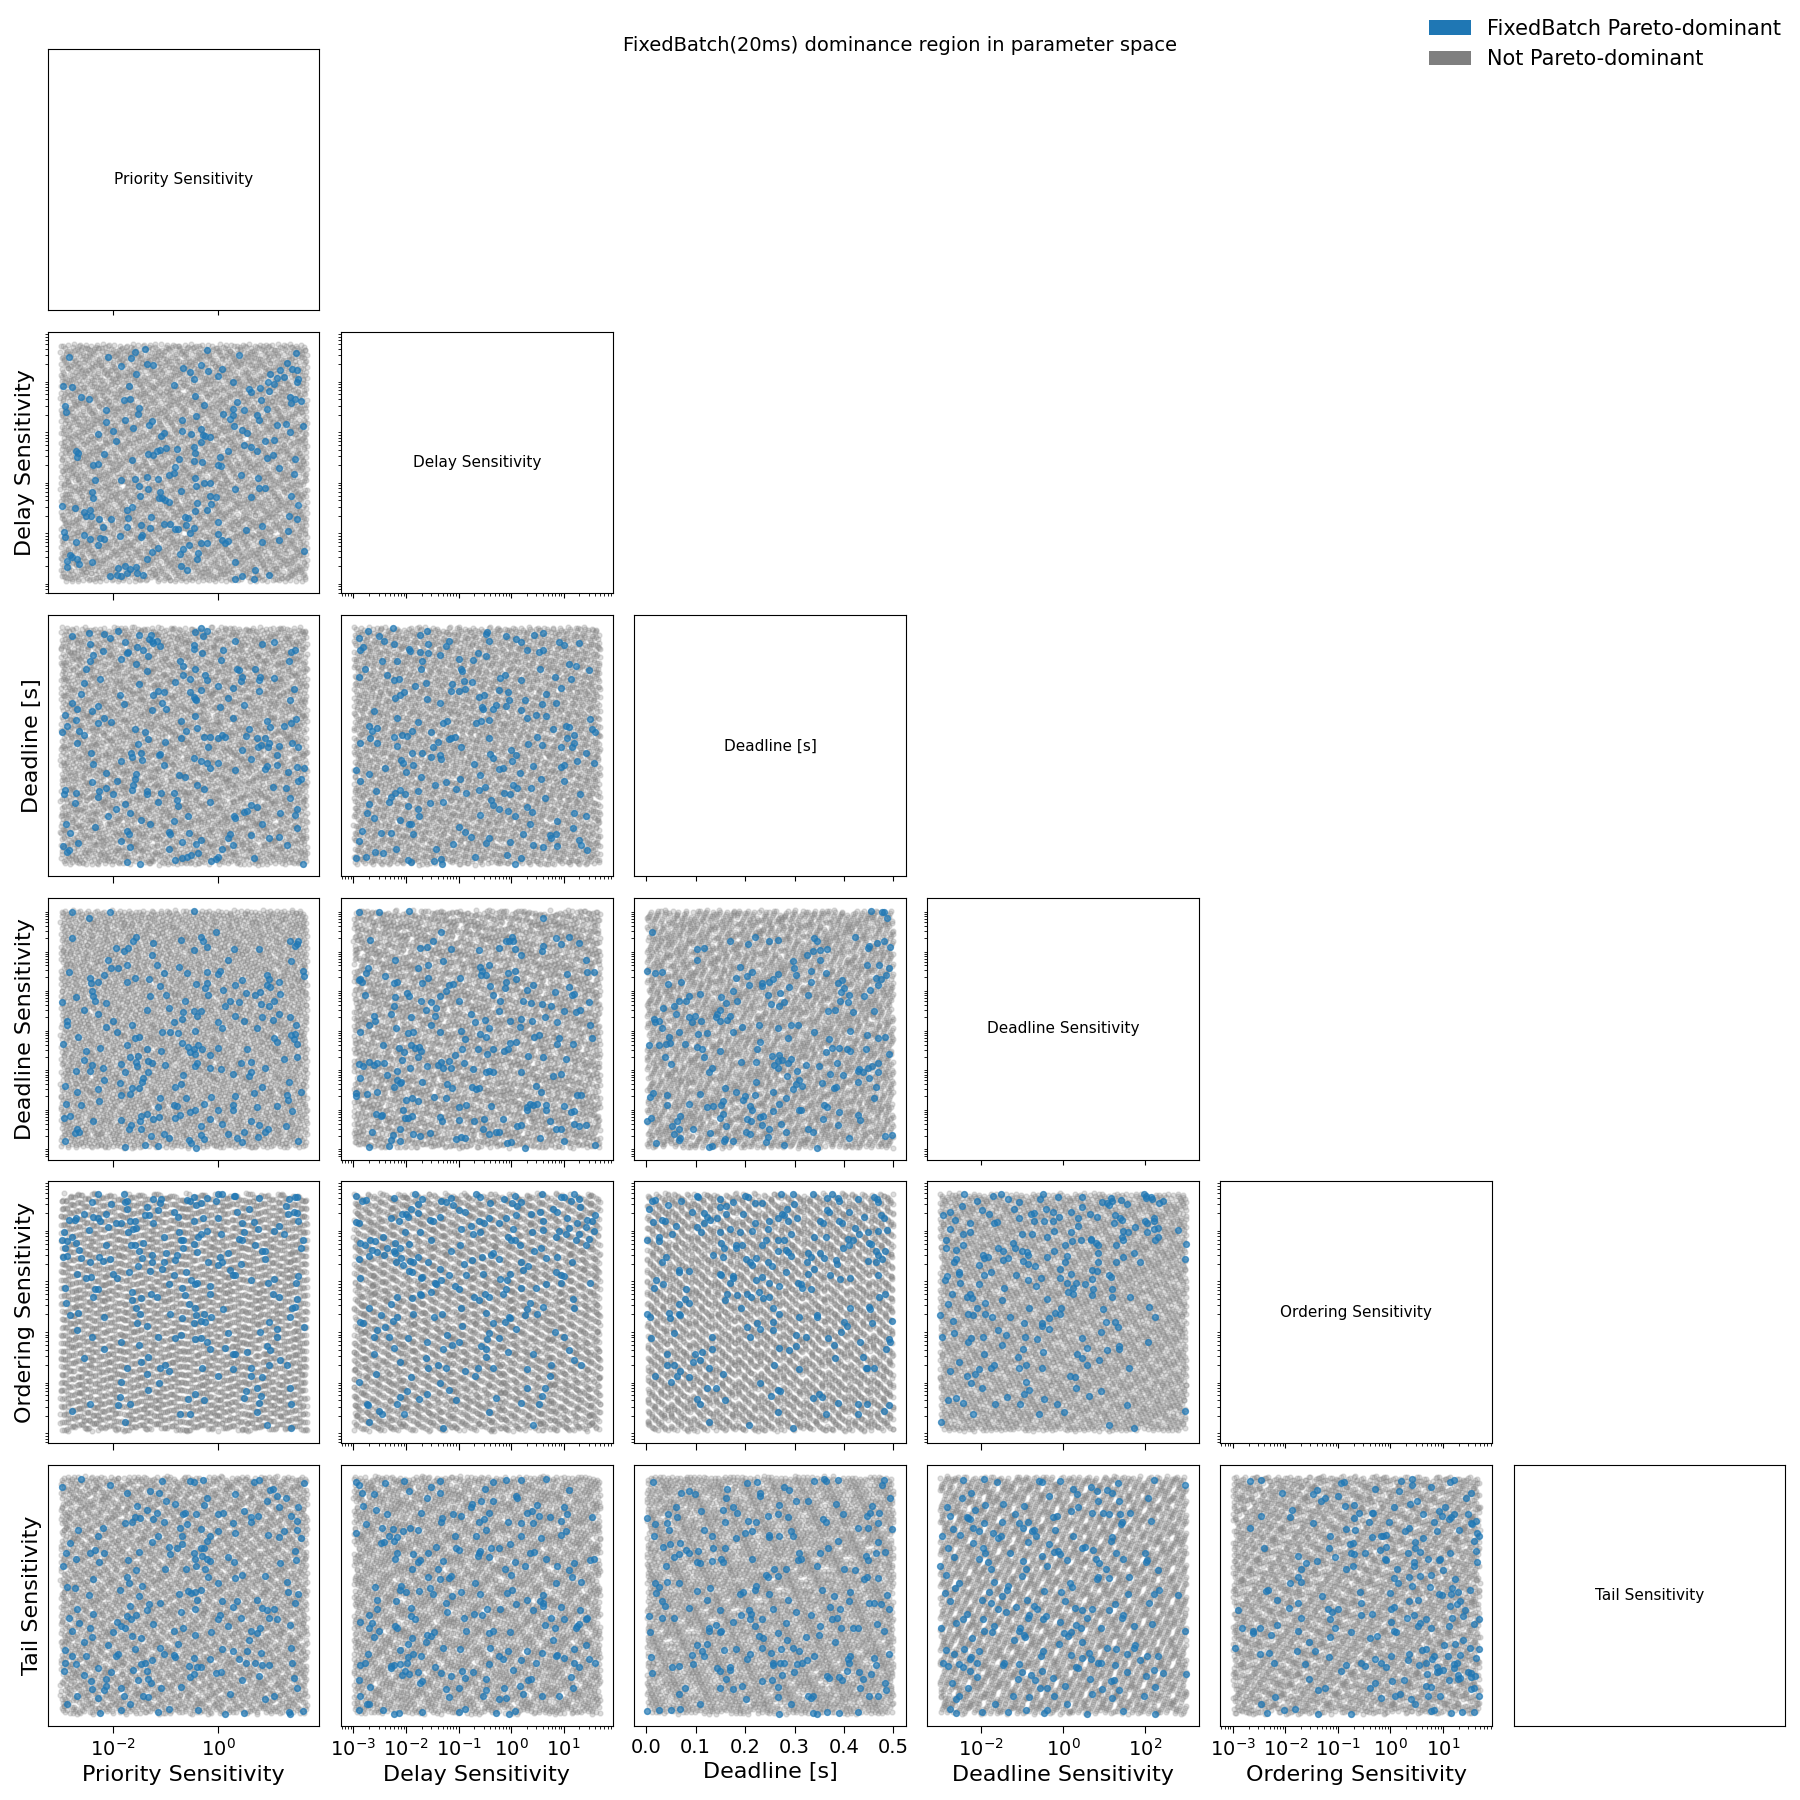
.png)
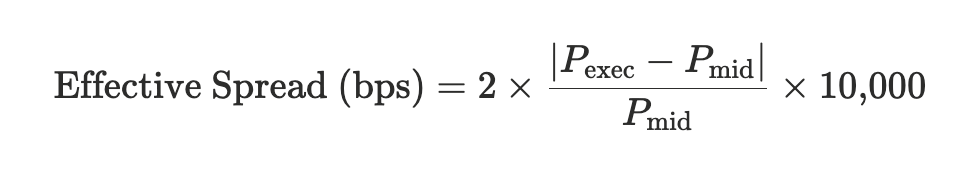
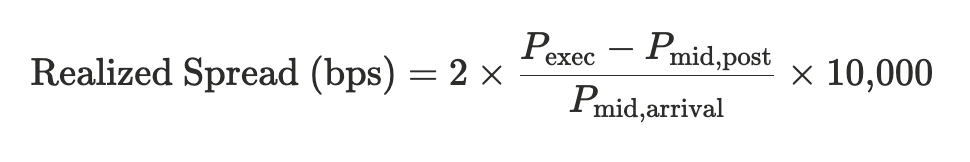
.png)
.png)
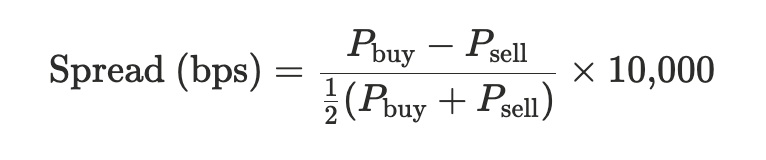
.png)
.png)
.png)
.png)
.png)
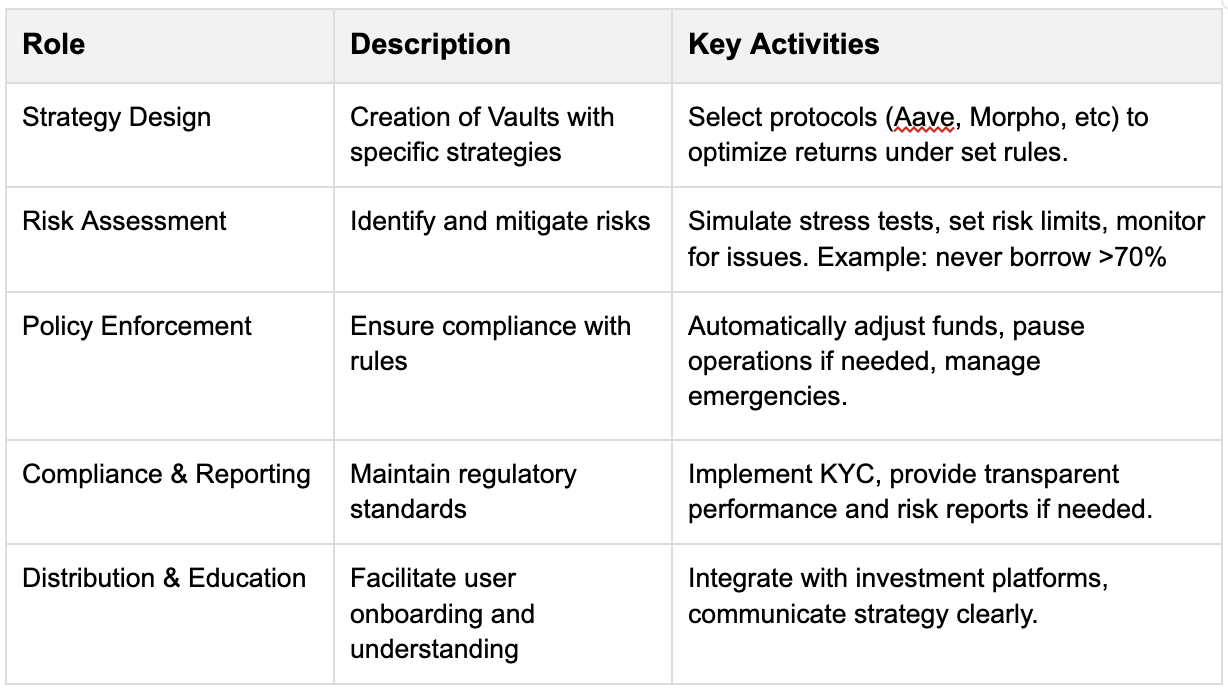
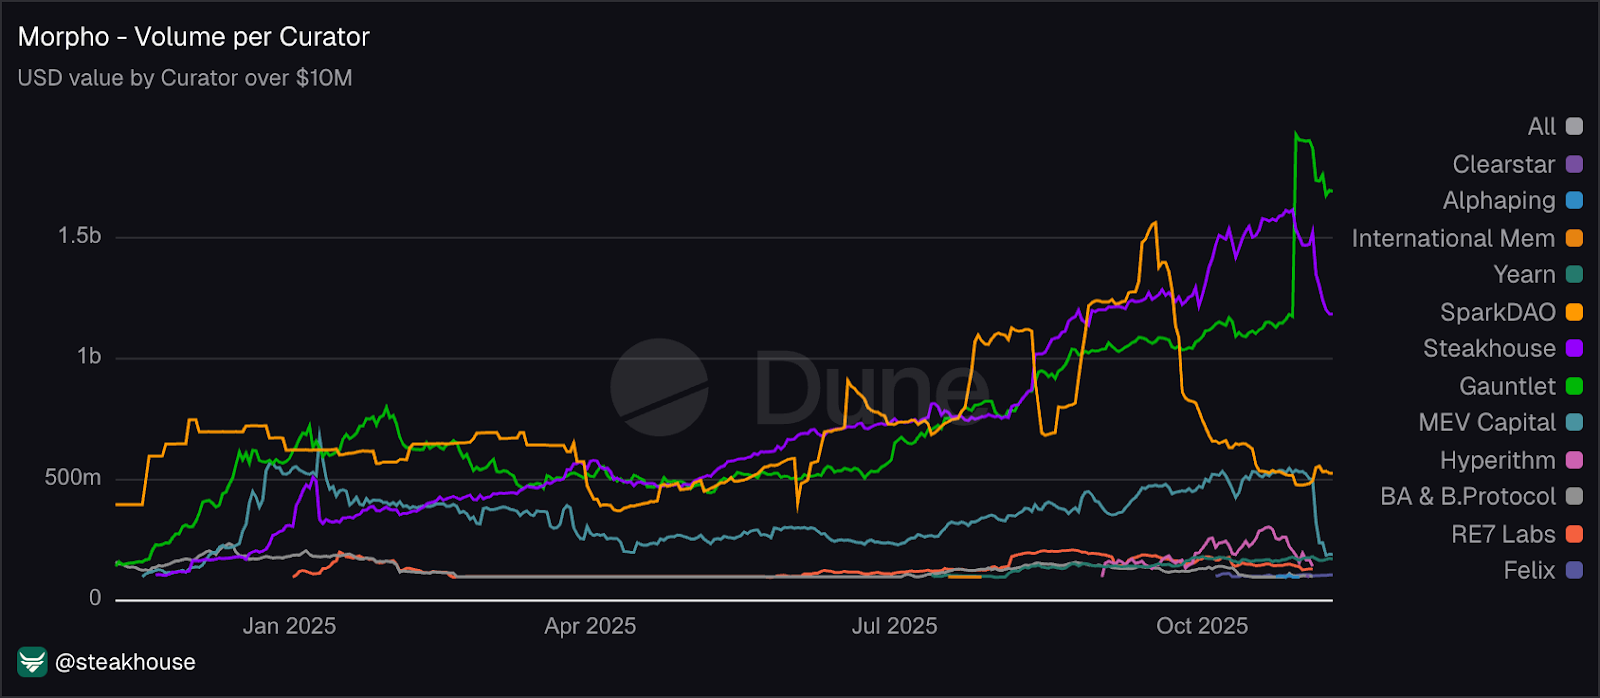


.png)


