Stay vigilant against phishing attacks. Chorus One sends emails exclusively to contacts who have subscribed. If you are in doubt, please don’t hesitate to reach out through our official communication channels.
Chorus One is now a part of Bitwise. Bitwise is a global, crypto-first asset manager with $11 billion+ in client assets and a diverse suite of investment solutions. Learn more about how Chorus One is growing as a part of Bitwise at onchain.bitwiseinvestments.com.
SAN FRANCISCO - February 19, 2026 - Bitwise Asset Management, the global crypto asset manager with over $15 billion in client assets, today announced the acquisition of Chorus One, a leading institutional staking provider with over $2.2 billion in staked assets.
Chorus One has joined Bitwise Onchain Solutions (“BOS”), the staking division of Bitwise, which supports several billion dollars in staked crypto assets. BOS primarily serves institutional investors, family offices, and financial platforms that value the combination of Bitwise’s fiduciary approach, track record of reliability, and native technical expertise. The acquisition accelerates BOS’s capabilities, including:
Expanded staking capabilities on over 30 proof-of-stake networks, including Solana, Hyperliquid, Monad, Avalanche, Sui, NEAR, Aptos, Tezos, TON, and others
Addition of 50 experienced technology professionals
Leading research coverage for clients on protocol and governance developments
“For our thousands of clients who hold spot crypto assets, staking is one of the most compelling growth opportunities,” said Bitwise CEO Hunter Horsley. “I’m thrilled about this acquisition and grateful to the Chorus One team for the trust placed in us. Chorus One is best-in-class across technology and research, with an eight-year track record of doing things the right way. We’re excited to add their capabilities to the value that Bitwise Onchain Solutions can create for clients.”
Since its inception in 2018, Chorus One’s team of infrastructure experts and researchers has earned the trust of a global client base, including family offices, high-net-worth individuals, funds, traditional financial institutions, exchanges, custodians, and decentralized protocols.
“The Chorus One team shares our commitment to technical rigor, open-source contribution, and deep research,” said Bitwise Chief Technology Officer Hong Kim. “With the foundation of Bitwise Onchain Solutions already in place, the integration of Chorus One will be a massive leap forward in our capabilities to serve clients and our commitment to industry-leading infrastructure and research.”
“Chorus One was built on the idea that investors deserve secure, professional access to the entire Proof-of-Stake landscape,” said Chorus One CEO and Co-founder Brian Crain. “We started with a belief that Proof-of-Stake would become the foundation of the digital economy. As we’ve grown to support over 30 networks, our core focus has always been on reliability, security, and performance. Joining Bitwise is a natural evolution; they share our DNA of excellence and our focus on meeting the sophisticated needs of investors. We’re thrilled to continue building the future of the onchain economy as part of this world-class firm.”
The core Chorus One team will join Bitwise, while Crain will join in an advisory role. With this deal, Bitwise now has nearly 200 employees worldwide, further solidifying its position as a dominant force in the digital asset space.
Keefe, Bruyette & Woods - A Stifel Company (KBW) served as exclusive financial advisor to Chorus One for this acquisition.
About Bitwise
Bitwise Asset Management is a global crypto asset manager with more than $15 billion in client assets and a suite of over 40 investment products spanning ETFs, separately managed accounts, private funds, hedge fund strategies, and staking. The firm has an eight-year track record and today serves more than 5,000 private wealth teams, RIAs, family offices, and institutional investors, as well as 21 banks and broker-dealers. The Bitwise team of nearly 200 technology and investment professionals is backed by leading institutional investors and has offices in San Francisco, New York, and London.
Lido v3 represents the most meaningful architectural shift in Lido’s history. Rather than simply improving liquid staking mechanics, it introduces a modular vault-based framework that fundamentally reshapes how staking interacts with DeFi. For institutions in particular, Lido v3 opens the door to configurable staking, operator choice, and native integration with on-chain strategies, all while preserving custody and control.
At Chorus One, we have been exploring the Lido v3 architecture, including building a proof-of-concept leveraged staking strategy using Morpho. This article is a technical walkthrough of Lido Vault Strategies: how they work, why they matter, and what they unlock for sophisticated stakers.
From Liquid Staking to Vault-Based Architecture
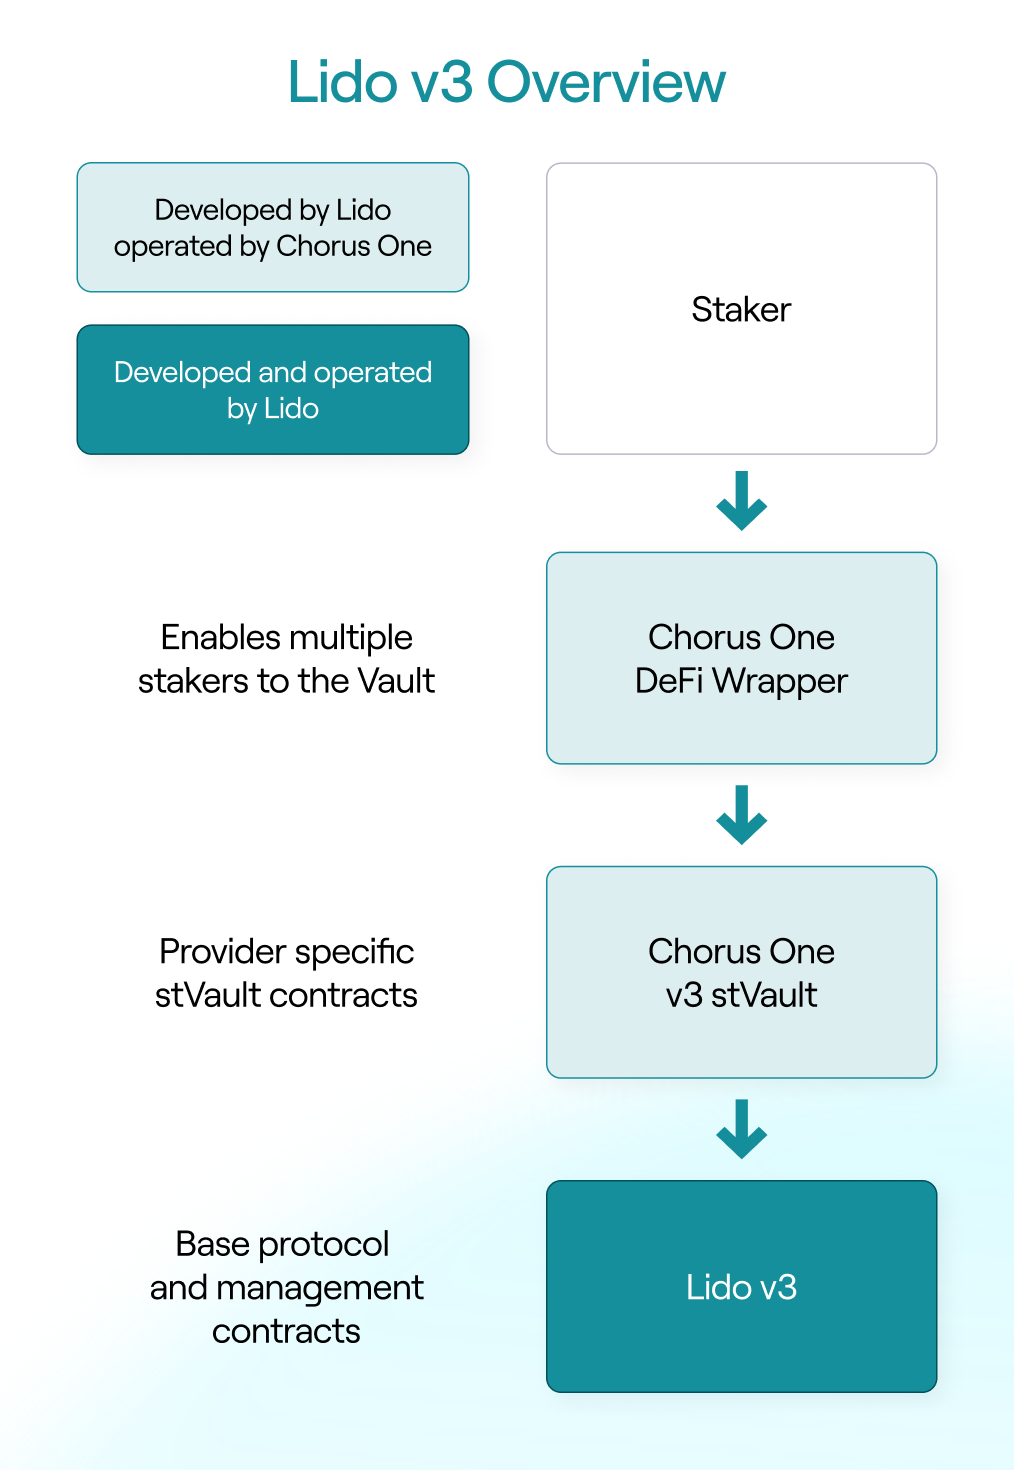
Lido v3 introduces stVaults, a new primitive that decouples staking infrastructure from token issuance and DeFi usage. At a high level, Lido v3 complements Lido Core Protocol with a layered architecture composed of three core components..
At the base is the Lido v3 protocol itself, which handles validator management, accounting, and withdrawals. On top of that sits the stVault, a vault contract deployed and operated by a specific node operator. Importantly, each stVault accepts stake from a single address only – a deliberate design choice that enables operator selection and simplifies accounting.
To enable multiple users to access the same vault, Lido introduces a DeFi Wrapper. This wrapper aggregates deposits from many users and interacts with the stVault on their behalf. When no strategy is applied, users can stake through the wrapper and receive staking exposure without any additional DeFi logic.
Why stVaults Matter for Institutions
The shift to stVaults is not just a technical upgrade – it is a structural change that directly addresses institutional requirements.
First, stVaults allow stakers to choose their staking partner. Unlike today’s pooled Lido model, where stake is distributed across operators by the protocol, institutions using stVaults can
Explicitly select the validator they trust and align with their compliance and operational requirements.
Second, Lido v3 enables staking without minting. Institutions are no longer forced to hold liquid staking tokens on their balance sheet, eliminating accounting and custody complications while retaining full staking exposure.
Third, when minting is desired, vaults support direct minting of wstETH, removing the need for additional swaps before entering DeFi. This small design choice has meaningful implications for efficiency, gas costs, and operational simplicity.
Finally, stVaults introduce a clean interface for custom staking strategies, enabling staking and DeFi interactions to be composed into a single, auditable workflow.
What Are Lido Vault Strategies?
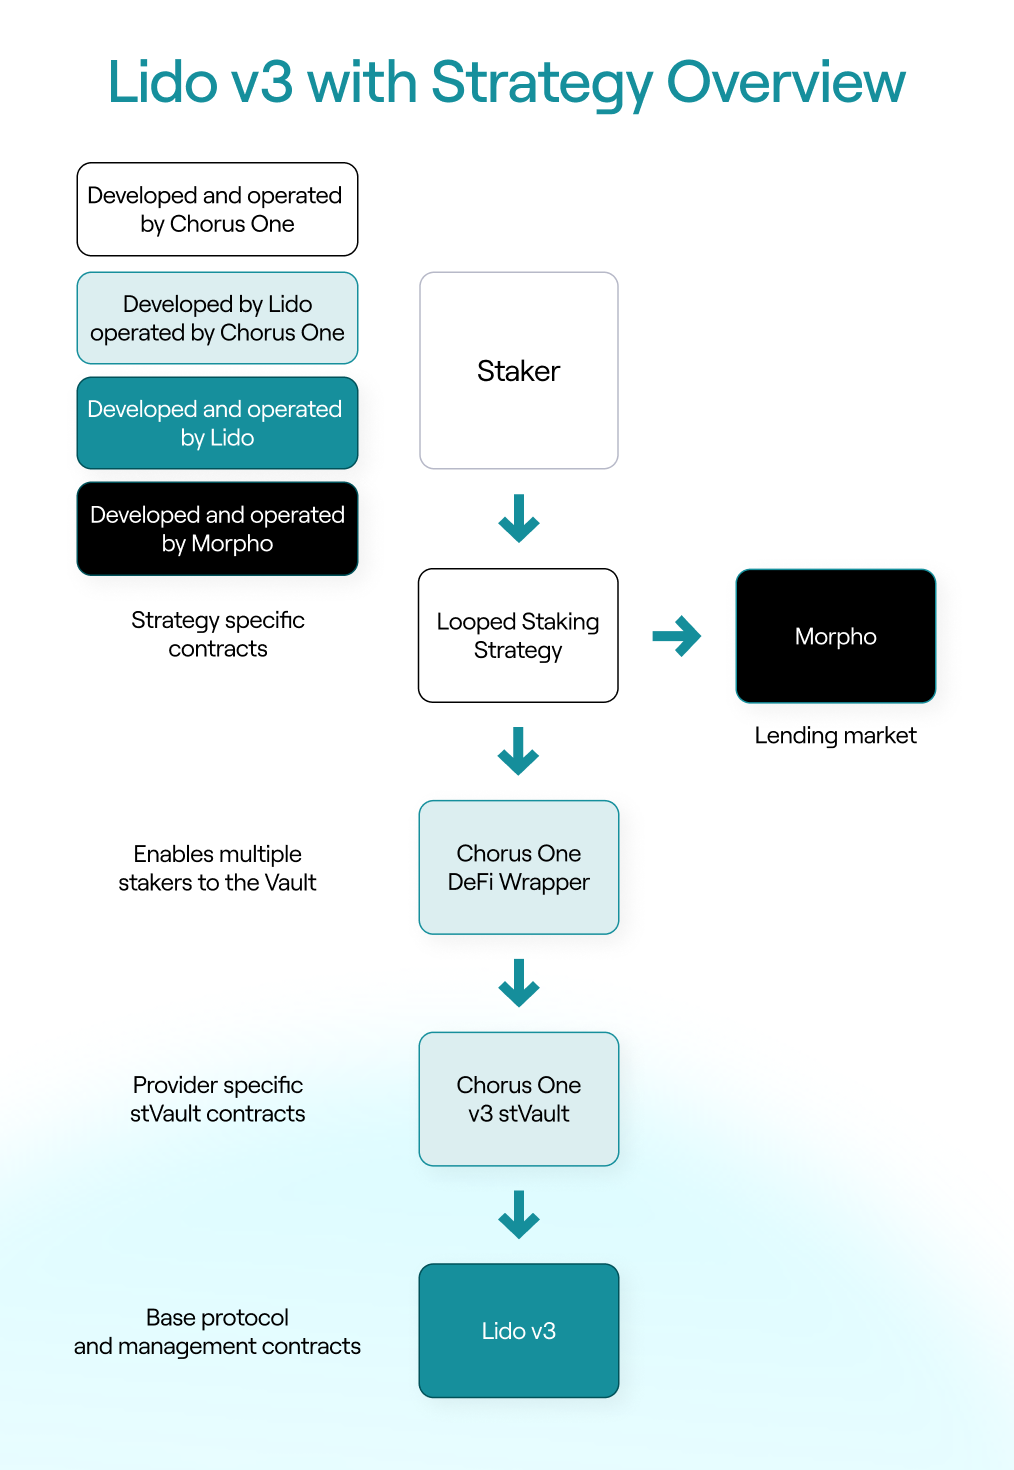
Lido Vault Strategies are optional smart contract layers placed in front of the DeFi Wrapper. Instead of interacting with the wrapper directly, users interact with the strategy contract, which orchestrates staking, minting, borrowing, and rebalancing logic on their behalf.
This design allows users to access additional on-chain opportunities, such as lending, liquidity provision, or structured yield strategies, without managing multiple contracts or transactions
themselves. Importantly, strategies are not required: a vault can operate purely as a staking vehicle. When added, however, strategies become the mechanism that enables more advanced capital usage while preserving Lido’s core security guarantees.
Connecting Staking to DeFi: Why This Matters Now
One of the most important implications of Lido v3 is how it simplifies connecting staking to existing DeFi venues. Protocols like Morpho have become key on-chain destinations for capital, including for crypto-native funds and increasingly for TradFi-linked participants seeking lending and borrowing exposure using assets like USDC.
What these venues generally lack is direct access to staking. Large financial institutions are comfortable with lending and collateralized borrowing, but staking remains unfamiliar territory.
Lido Vaults change this dynamic. By starting upstream with staking and flowing downstream into DeFi, vault strategies provide a natural bridge: participants already active in lending markets can begin to understand staking not as a separate activity, but as an integrated source of yield and collateral. Over time, this structure lowers the conceptual barrier to staking for institutions that otherwise would not engage with it directly.
Leveraged Staking on Lido v3: A Technical Exploration
To understand the practical implications of Vault Strategies, Chorus One built an early-stage proof-of-concept leveraged staking strategy using Lido v3 and Morpho.
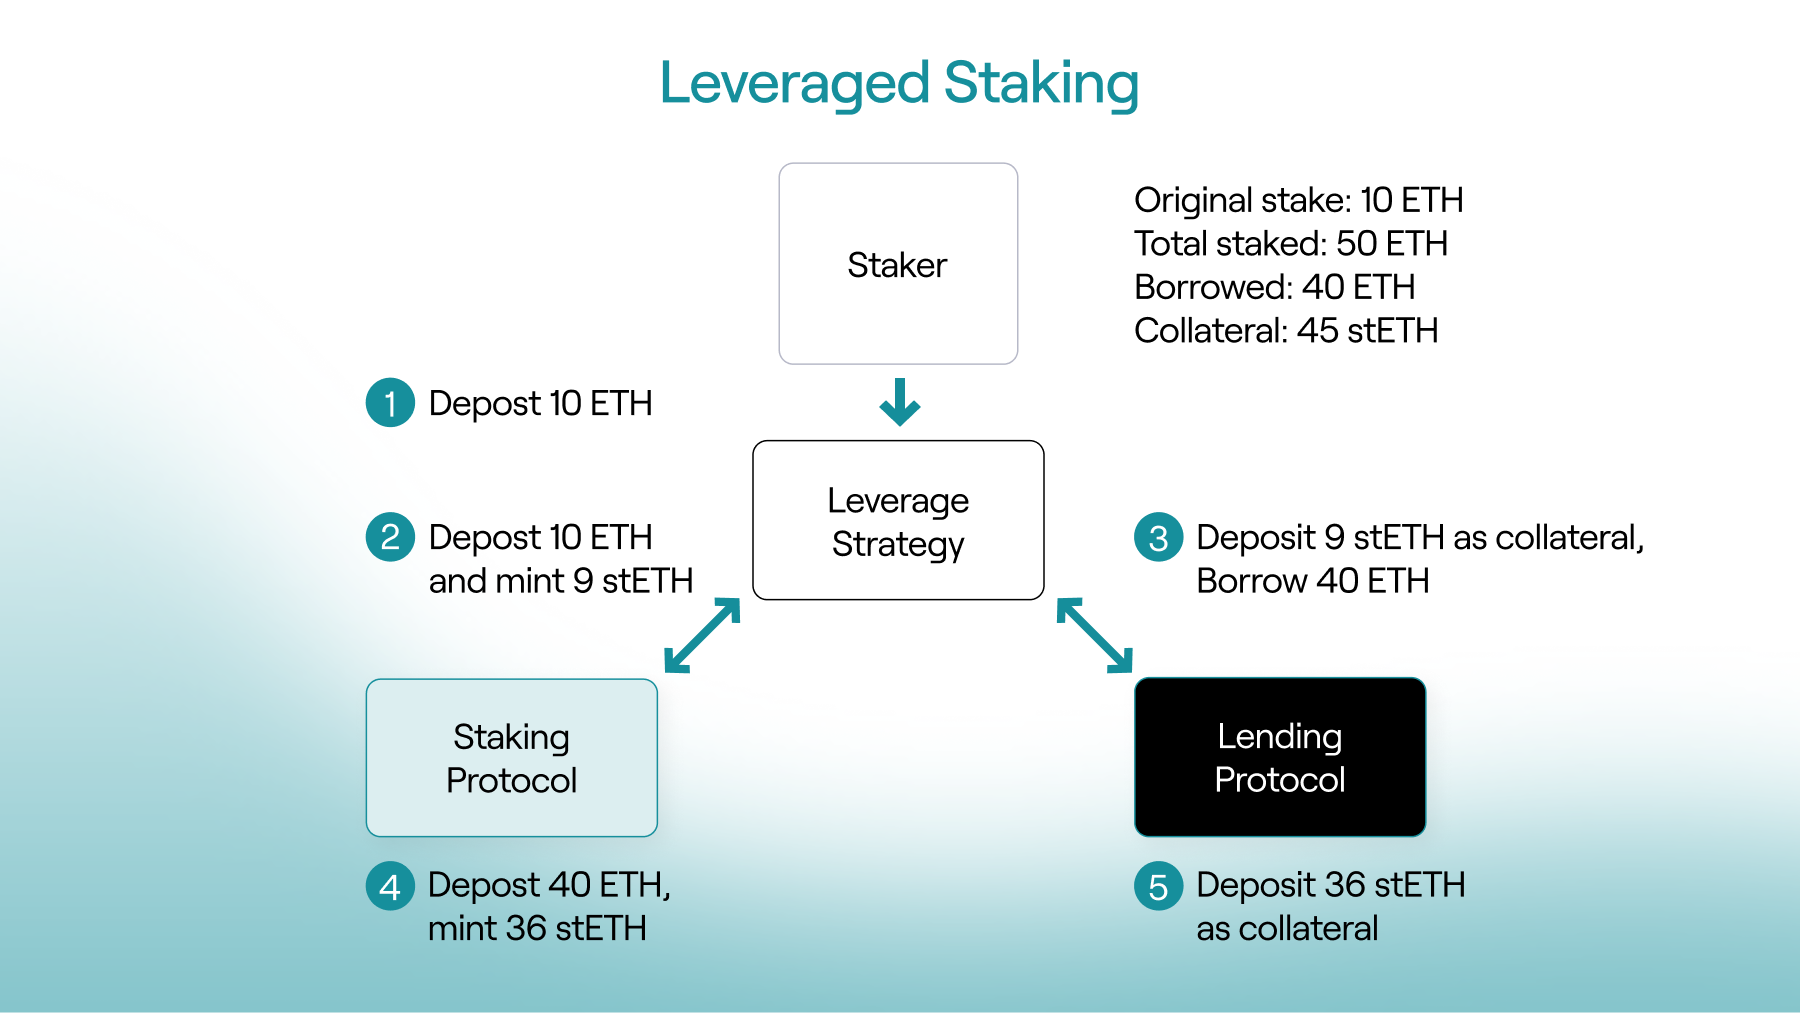
What is leveraged staking? Leveraged staking involves borrowing ETH against staked collateral (wstETH) and restaking the borrowed ETH to amplify staking rewards. Traditionally, this requires looping: stake, mint, borrow, restake. Lido v3 however, enables a far cleaner, less complex approach.
Using a strategy contract and Morpho’s callback architecture, we were able to design a flow where users can enter a leveraged position in a single transaction, at any target leverage level, without looping. Gas costs remain constant regardless of leverage, and contract complexity is reduced significantly.
Equally important is the exit path. One of the hardest problems in leveraged staking is unwinding positions during withdrawals. Lido v3 introduces a withdrawal-with-rebalancing feature that allows the loan to be repaid and the withdrawal to be requested in the same transaction. This means positions can be unwound immediately, without waiting days in the withdrawal queue while a loan remains outstanding.
From a technical perspective, this combination – strategy contracts, Morpho callbacks, and Lido’s rebalancing withdrawals – makes leveraged staking both capital and operationally more efficient than previous designs.
Engineering Is Only the Starting Point
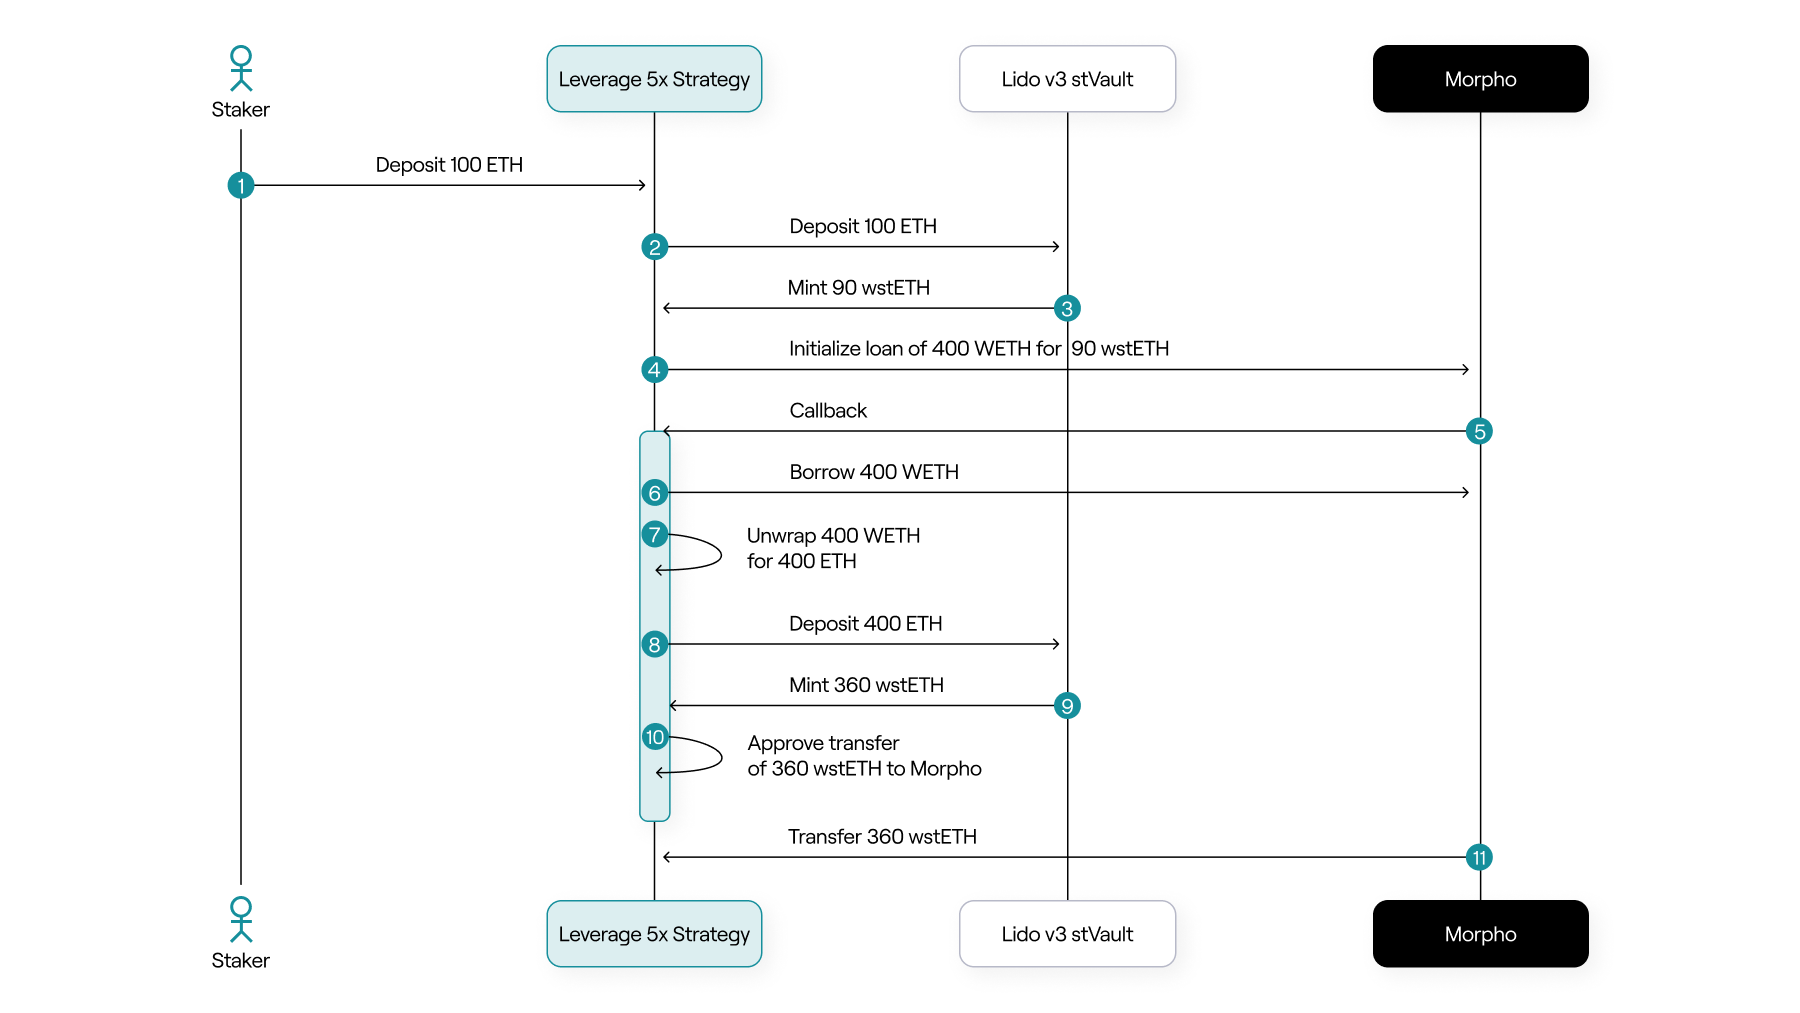
Building the strategy contract itself was feasible using largely off-the-shelf components. Lido v3 is highly composable by design, the rebalancing feature, and Morpho’s callback architecture significantly simplifies both entry and exit flows.
Simplified diagram, assumes wstETH/ETH is 1:1.
However, the most important lesson was that contract development is only a fraction of the work required to build an institutional-grade vault strategy.
Robust products require published risk analysis covering every protocol and asset involved, risk controls embedded directly into contracts and operational workflows, thoughtful financial structuring for downside protection, real-time monitoring with alerting and emergency procedures. They also require active financial operations, including fund rebalancing and emergency unwinds when market conditions demand it.
Recent DeFi vault failures have shown that technical sophistication alone is insufficient. Many curators can build contracts that work when conditions are favorable, but lack the risk discipline needed to operate through stress events. This is where infrastructure providers must differentiate themselves.
Why This Matters for Lido and Its Operator Set
Lido v3 stVaults are not just a new staking interface — they are an invitation for operators to step into an active role with more visibility and responsibility. Operators are no longer anonymous infrastructure providers; they become integral participants in how staking and DeFi strategies are designed, operated, and risk-managed.
For Chorus One, this aligns closely with how we already operate across other ecosystems. As a SOC 2-compliant, ISO 27001-certified provider based in Switzerland, we see Lido v3 as a natural evolution of institutional staking rather than a departure from it.
Looking Ahead
Lido v3 stVaults are expected to launch in 2026. When they do, staking will no longer be a terminal activity: it will be the first step into programmable, risk-managed DeFi strategies that can be accessed in a single transaction.
DeFi is going institutional, and that transition starts with staking. With Lido v3, users no longer need to choose between staking yield and DeFi participation. They can have both – cleanly, transparently, and with operator accountability.
At Chorus One, we are excited to bring these strategies to market, beginning with public vaults and expanding to private, customized deployments. If you are interested in exploring Lido Vault Strategies or learning how they can be tailored to your needs, we would be glad to continue the conversation.
Chorus One is strengthening the Hyperliquid validator ecosystem by open-sourcing a tool to allow signing actions with a Ledger wallet.
By default, Hyperliquid validators must use a non-rotatable key that holds self-bonded funds and the validator’s identity when performing governance and validator actions.
Our Hyperliquid signer removes this risk by enabling validator registration, metadata updates, and governance actions to be performed entirely from a Ledger hardware wallet.
The validator key is never exposed online. This is especially critical for governance voting, where validator keys are used frequently, and attack surfaces are at their highest.
Alongside the existing Hyperliquid multisig support, our tool further strengthens the security of the Hyperliquid ecosystem.Access our Hyperliquid signing tool here, available now to the community: https://github.com/ChorusOne/hyperliquid-ledger-signer/
Chorus One, one of the world’s leading institutional staking providers, today announced a new collaboration with Ledger, the world leader in digital asset security for consumers and enterprises, through its Ledger Enterprise platform. Through this collaboration, institutions can participate in Proof-of-Stake networks without transferring custody of their digital assets, while benefiting from Chorus One’s secure, research-backed staking operations.
“Institutions need staking solutions that match their security, compliance, and operational requirements. Integrating with Ledger Enterprise allows us to deliver a streamlined staking experience that keeps governance firmly in the hands of the client while providing the performance and reliability Chorus One is known for.” - Damien Scanlon, Chief Product Officer at Chorus One.
“Companies are adopting digital assets at a rapid pace worldwide, but uncompromising security and governance remain fundamental prerequisites. By integrating Chorus One’s staking infrastructure into the Ledger Enterprise platform, we make it simpler for institutions to earn staking yields with security and governance. This partnership delivers the best of both worlds: high-performance staking combined with robust self-custody.” - Sébastien Badault, Executive Vice President, Ledger Enterprise
The Ledger Enterprise platform provides hardware-secured private key protection, policy-based governance, multi-authorization workflows, and comprehensive auditability. This integration allows staking operations, including delegation and reward management, to occur entirely within the institution’s existing governance framework.
Key benefits of the integration include:
Security-first architecture, with private keys protected by Ledger’s secure hardware and governance controls.
Institutional-grade validator performance backed by Chorus One’s operational reliability and risk-mitigation processes.
Configurable governance workflows, including multi-authorization approval pathways and policy-based controls.
Comprehensive reporting and auditability for compliance and treasury management.
This connection expands Chorus One’s global footprint across institutional staking and strengthens Ledger Enterprise’s offering as a governance-focused, end-to-end digital asset management platform.
About Chorus One
Chorus One is one of the largest institutional staking providers globally, operating infrastructure for over 40 Proof-of-Stake (PoS) networks, including Cosmos, Solana, Avalanche, and Near. Since 2018, the company has been at the forefront of the PoS industry, offering easy-to-use, enterprise-grade staking solutions, conducting industry-leading research, and investing in innovative protocols through Chorus One Ventures. Chorus One is an ISO27001 certified provider for institutional digital asset staking.
About Ledger
Celebrating its 10 year anniversary in 2024, Ledger is the world leader in Digital Asset security for consumers and enterprises. Ledger offers connected devices and platforms, with more than 8M devices sold to consumers in 165+ countries and 10+ languages, 100+ financial institutions and commercial brands. Over 20% of the world’s crypto assets are secured by Ledger.
Ledger is the digital asset solution secure by design. The world’s most internationally respected offensive security team, Ledger Donjon, is relied upon as a crucial resource for securing the world of Digital Assets. With over 14 billion dollars hacked, scammed or mismanaged in 2023 alone, Ledger’s security brings peace of mind and uncompromising self-custody to its community.
Don’t buy “a hardware wallet.” Buy a LEDGER™ signer.
LEDGER™, LEDGER WALLET™, LEDGER RECOVER™, LEDGER STAX™, LEDGER FLEX™ and LEDGER NANO™ are trademarks owned by Ledger SAS
Bluetooth® word mark and logos are registered trademarks owned by Bluetooth SIG, Inc. and any use of such marks by Ledger is under license.
E Ink® is a registered trademark of E Ink Corporation.