
In the world of blockchain technology, where every millisecond counts, the speed of light isn’t just a scientific constant—it’s a hard limit that defines the boundaries of performance. As Kevin Bowers highlighted in his article Jump Vs. the Speed of Light, the ultimate bottleneck for globally distributed systems, like those used in trading and blockchain, is the physical constraint of how fast information can travel.
To put this into perspective, light travels at approximately 299,792 km/s in a vacuum, but in fiber optic cables (the backbone of internet communication), it slows to about 200,000 km/s due to the medium's refractive index. This might sound fast, but when you consider the distances involved in a global network, delays become significant. For example:
For applications like high-frequency trading or blockchain consensus mechanisms, this delay is simply too long. In decentralized systems, the problem worsens because nodes must exchange multiple messages to reach agreement (e.g., propagating a block and confirming it). Each round-trip adds to the latency, making the speed of light a "frustrating constraint" when near-instant coordination is the goal.
Beyond the physical delay imposed by the speed of light, blockchain networks face an additional challenge rooted in information theory: the Shannon Capacity Theorem. This theorem defines the maximum rate at which data can be reliably transmitted over a communication channel. It’s expressed as:
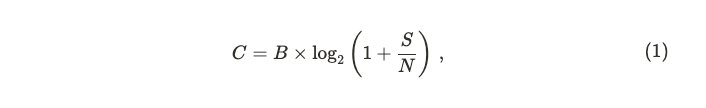
where C is the channel capacity (bits per second), B is the bandwidth (in hertz), and S/N is the signal-to-noise ratio. In simpler terms, the theorem tells us that even with a perfect, lightspeed connection, there’s a ceiling on how much data a network can handle, determined by its bandwidth and the quality of the signal.
For blockchain systems, this is a critical limitation because they rely on broadcasting large volumes of transaction data to many nodes simultaneously. So, even if we could magically eliminate latency, the Shannon Capacity Theorem reminds us that the network’s ability to move data is still finite. For blockchains aiming for mass adoption—like Solana, which targets thousands of transactions per second—this dual constraint of light speed and channel capacity is a formidable hurdle.
In a computing landscape where recent technological advances have prioritized fitting more cores into a CPU rather than making them faster, and where the speed of light emerges as the ultimate bottleneck, Jump team refuses to settle for off-the-shelf solutions or the short-term fix of buying more hardware. Instead, it reimagines existing solutions to extract maximum performance from the network layer, optimizing data transmission, reducing latency, and enhancing reliability to combat the "noise" of packet loss, congestion, and global delays.
The Firedancer project is about tailoring this concept for a blockchain world where every microsecond matters, breaking the paralysis in decision-making that arises when systems have many unoptimized components.
Firedancer is a high-performance validator client developed in C for the Solana blockchain, developed by Jump Crypto, a division of Jump Trading focused on advancing blockchain technologies. Unlike traditional validator clients that rely on generic software stacks and incremental hardware upgrades, Firedancer is a ground-up reengineering of how a blockchain node operates. Its mission is to push the Solana network to the very limits of what’s physically possible, addressing the dual constraints of light speed and channel capacity head-on.
At its core, Firedancer is designed to optimize every layer of the system, from data transmission to transaction processing. It proposes a major rewrite of the three functional components of the Agave client: networking, runtime, and consensus mechanism.
Firedancer is a big project, and for this reason it is being developed incrementally. The first Firedancer validator is nicknamed Frankendancer. It is Firedancer’s networking layer grafted onto the Agave runtime and consensus code. Precisely, Frankendancer has implemented the following parts:
All other functionality is retained by Agave, including the runtime itself which tracks account state and executes transactions.
In this article, we’ll dive into on-chain data to compare the performance of the Agave client with Frankendancer. Through data-driven analysis, we quantify if these advancements can be seen on-chain via Solana’s performance. This means that not all improvements will be visible via this analysis.
You can walk through all the data used in this analysis via our dedicated dashboard.
While signature verification and block distribution engines are difficult to track using on-chain data, studying the dynamical behaviour of transactions can provide useful information about QUIC implementation and block packing logic.
Transactions on Solana are encoded and sent in QUIC streams into validators from clients, cfr. here. QUIC is relevant during the FetchStage, where incoming packets are batched (up to 128 per batch) and prepared for further processing. It operates at the kernel level, ensuring efficient network input handling. This makes QUIC a relevant piece of the Transaction Processing Unit (TPU) on Solana, which represents the logic of the validator responsible for block production. Improving QUIC means ultimately having control on transaction propagation. In this section we are going to compare the Agave QUIC implementation with the Frankendancer fd_quic—the C implementation of QUIC by Jump Crypto.

The first difference relies on connection management. Agave utilizes a connection cache to manage connections, implemented via the solana_connection_cache module, meaning there is a lookup mechanism for reusing or tracking existing connections. It also employs an AsyncTaskSemaphore to limit the number of asynchronous tasks (set to a maximum of 2000 tasks by default). This semaphore ensures that the system does not spawn excessive tasks, providing a basic form of concurrency control.
Frankendancer implements a more explicit and granular connection management system using a free list (state->free_conn_list) and a connection map (fd_quic_conn_map) based on connection IDs. This allows precise tracking and allocation of connection resources. It also leverages receive-side scaling and kernel bypass technologies like XDP/AF_XDP to distribute incoming traffic across CPU cores with minimal overhead, enhancing scalability and performance, cfr. here. It does not rely on semaphores for task limiting; instead, it uses a service queue (svc_queue) with scheduling logic (fd_quic_svc_schedule) to manage connection lifecycle events, indicating a more sophisticated event-driven approach.
Frankendancer also implements a stream handling pipeline. Precisely, fd_quic provides explicit stream management with functions like fd_quic_conn_new_stream() for creation, fd_quic_stream_send() for sending data, and fd_quic_tx_stream_free() for cleanup. Streams are tracked using a fd_quic_stream_map indexed by stream IDs.
Finally, for packet processing, Agave approach focuses on basic packet sending and receiving, with asynchronous methods like send_data_async() and send_data_batch_async().
Frankendancer implements detailed packet processing with specific handlers for different packet types: fd_quic_handle_v1_initial(), fd_quic_handle_v1_handshake(), fd_quic_handle_v1_retry(), and fd_quic_handle_v1_one_rtt(). These functions parse and process packets according to their QUIC protocol roles.
Differences in QUIC implementation can be seen on-chain at transactions level. Indeed, a more "sophisticated" version of QUIC means better handling of packets and ultimately more availability for optimization when sending them to the block packing logic.
After the FetchStage and the SigVerifyStage—which verifies the cryptographic signatures of transactions to ensure they are valid and authorized—there is the Banking stage. Here verified transactions are processed.

At the core of the Banking stage is the scheduler. It represents a critical component of any validator client, as it determines the order and priority of transaction processing for block producers.
Agave implements a central scheduler introduced in v2.18. Its main purpose is to loop and constantly check the incoming queue of transactions and process them as they arrive, routing them to an appropriate thread for further processing. It prioritizes transaction accordingly to

The scheduler is responsible for pulling transactions from the receiver channel, and sending them to the appropriate worker thread based on priority and conflict resolution. The scheduler maintains a view of which account locks are in-use by which threads, and is able to determine which threads a transaction can be queued on. Each worker thread will process batches of transactions, in the received order, and send a message back to the scheduler upon completion of each batch. These messages back to the scheduler allow the scheduler to update its view of the locks, and thus determine which future transactions can be scheduled, cfr. here.
Frankendancer implements its own scheduler in fd_pack. Within fd_pack, transactions are prioritized based on their reward-to-compute ratio—calculated as fees (in lamports) divided by estimated CUs—favoring those offering higher rewards per resource consumed. This prioritization happens within treaps, a blend of binary search trees and heaps, providing O(log n) access to the highest-priority transactions. Three treaps—pending (regular transactions), pending_votes (votes), and pending_bundles (bundled transactions)—segregate types, with votes balanced via reserved capacity and bundles ordered using a mathematical encoding of rewards to enforce FIFO sequencing without altering the treap’s comparison logic.
Scheduling, driven by fd_pack_schedule_next_microblock, pulls transactions from these treaps to build microblocks for banking tiles, respecting limits on CUs, bytes, and microblock counts. It ensures votes get fair representation while filling remaining space with high-priority non-votes, tracking usage via cumulative_block_cost and data_bytes_consumed.
To resolve conflicts, it uses bitsets—a container that represents a fixed-size sequence of bits—which are like quick-reference maps. Bitsets—rw_bitset (read/write) and w_bitset (write-only)—map account usage to bits, enabling O(1) intersection checks against global bitset_rw_in_use and bitset_w_in_use. Overlaps signal conflicts (e.g., write-write or read-write clashes), skipping the transaction. For heavily contested accounts (exceeding PENALTY_TREAP_THRESHOLD of 64 references), fd_pack diverts transactions to penalty treaps, delaying them until the account frees up, then promoting the best candidate back to pending upon microblock completion. A slow-path check via acct_in_use—a map of account locks per bank tile—ensures precision when bitsets flag potential issues.
Vote fees on Solana are a vital economic element of its consensus mechanism, ensuring network security and encouraging validator participation. In Solana’s delegated Proof of Stake (dPoS) system, each active validator submits one vote transaction per slot to confirm the leader’s proposed block, with an optimal delay of one slot. Delays, however, can shift votes into subsequent slots, causing the number of vote transactions per slot to exceed the active validator count. Under the current implementation, vote transactions compete with regular transactions for Compute Unit (CU) allocation within a block, influencing resource distribution.

Data reveals that the Frankendancer client includes more vote transactions than the Agave client, resulting in greater CU allocation to votes. To evaluate this difference, a dynamic Kolmogorov-Smirnov (KS) test can be applied. This non-parametric test compares two distributions by calculating the maximum difference between their Cumulative Distribution Functions (CDFs), assessing whether they originate from the same population. Unlike parametric tests with specific distributional assumptions, the KS-test’s flexibility suits diverse datasets, making it ideal for detecting behavioral shifts in dynamic systems. The test yields a p-value, where a low value (less than 0.05) indicates a significant difference between distributions.

When comparing CU usage for non-vote transactions between Agave (Version 2.1.14) and Frankendancer (Version 0.406.20113), the KS-test shows that Agave’s CDF frequently lies below Frankendancer’s (visualized as blue dots). This suggests that Agave blocks tend to allocate more CUs to non-vote transactions compared to Frankendancer. Specifically, the probability of observing a block with lower CU usage for non-votes is higher in Frankendancer relative to Agave.

Interestingly, this does not correspond to a lower overall count of non-vote transactions; Frankendancer appears to outperform Agave in including non-vote transactions as well. Together, these findings imply that Frankendancer validators achieve higher rewards, driven by increased vote transaction inclusion and efficient CU utilization for non-vote transactions.
Why Frankendancer is able to process more vote transactions may be due to the fact that on Agave there is a maximum number of QUIC connections that can be established between a client (identified by IP Address and Node Pubkey) and the server, ensuring network stability. The number of streams a client can open per connection is directly tied to their stake. Higher-stake validators can open more streams, allowing them to process more transactions concurrently, cfr. here. During high network load, lower-stake validators might face throttling, potentially missing vote opportunities, while higher-stake validators, with better bandwidth, can maintain consistent voting, indirectly affecting their influence in consensus. Frankendancer doesn't seem to suffer from the same restriction.
Although inclusion of vote transactions plays a relevant role in Solana consensus, there are other two metrics that are worth exploring: Skip Rate and Validator Uptime.
Skip Rate determines the availability of a validator to correctly propose a block when selected as leader. Having a high skip rate means less total rewards, mainly due to missed MEV and Priority Fee opportunities. However, missing a high number of slots also reduces total TPS, worsening final UX.
Validator Uptime impacts vote latency and consequently final staking rewards. This metric is estimated via Timely Vote Credit (TVC), which indirectly measures the distance a validator takes to land its votes. A 100% effectiveness on TVC means that validators land their votes in less than 2 slots.

As we can see, there are no main differences pre epoch 755. Data shows a recent elevated Skip Rate for Frankendancer and a corresponding low TVC effectiveness. However, it is worth noting that, since these metrics are based on averages, and considering a smaller stake is running Frankendancer, small fluctuations in Frankendancer performances need more time to be reabsorbed.
The scheduler plays a critical role in optimizing transaction processing during block production. Its primary task is to balance transaction prioritization—based on priority fees and compute units—with conflict resolution, ensuring that transactions modifying the same account are processed without inconsistencies. The scheduler orders transactions by priority, then groups them into conflict-free batches for parallel execution by worker threads, aiming to maximize throughput while maintaining state coherence. This balancing act often results in deviations from the ideal priority order due to conflicts.
To evaluate this efficiency, we introduced a dissipation metric, D, that quantifies the distance between a transaction’s optimal position o(i)—based on priority and dependent on the scheduler— and its actual position in the block a(i), defined as

where N is the number of transactions in the considered block.
This metric reveals how well the scheduler adheres to the priority order amidst conflict constraints. A lower dissipation score indicates better alignment with the ideal order. It is clear that the dissipation D has an intrinsic factor that accounts for accounts congestion, and for the time-dependency of transactions arrival. In an ideal case, these factors should be equal for all schedulers.
Given the intrinsic nature of the dissipation, the numerical value of this estimator doesn't carry much relevance. However, when comparing the results for two types of scheduler we can gather information on which one resolves better conflicts. Indeed, a higher value of the dissipation estimator indicates a preference towards conflict resolutions rather than transaction prioritization.

Comparing Frankendancer and Agave schedulers highlights how dissipation is higher for Frankendancer, independently from the version. This is more clear when showing the dynamical KS test. Only for very few instances the Agave scheduler showed a higher dissipation with statistically significant evidence.

If the resolution of conflicts—and then parallelization—is due to the scheduler implementation or to QUIC implementation is hard to tell from these data. Indeed, a better resolution of conflicts can be achieved also by having more transactions to select from.

Finally, also by comparing the percentiles of Priority Fees for transactions we can see hints of a different conflict resolution from Frankendancer. Indeed, despite the overall number of transactions (both vote and non-vote) and extracted value being higher than Agave, the median of PF is lower.
In this article we provide a detailed comparison of the Agave and Frankendancer validator clients on the Solana blockchain, focusing on on-chain performance metrics to quantify their differences. Frankendancer, the initial iteration of Jump Crypto’s Firedancer project, integrates an advanced networking layer—including a high-performance QUIC implementation and kernel bypass—onto Agave’s runtime and consensus code. This hybrid approach aims to optimize transaction processing, and the data reveals its impact.
On-chain data shows Frankendancer includes more vote transactions per block than Agave, resulting in greater compute unit (CU) allocation to votes, a critical factor in Solana’s consensus mechanism. This efficiency ties to Frankendancer’s QUIC and scheduler enhancements. Its fd_quic implementation, with granular connection management and kernel bypass, processes packets more effectively than Agave’s simpler, semaphore-limited approach, enabling better transaction propagation.
The scheduler, fd_pack, prioritizes transactions by reward-to-compute ratio using treaps, contrasting Agave’s priority formula based on fees and compute requests. To quantify how well each scheduler adheres to ideal priority order amidst conflicts we developed a dissipation metric. Frankendancer’s higher dissipation, confirmed by KS-test significance, shows it prioritizes conflict resolution over strict prioritization, boosting parallel execution and throughput. This is further highlighted by Frankendancer’s median priority fees being lower.
A lower median for Priority Fees and higher extracted value indicates more efficient transaction processing. For validators and delegators, this translates to increased revenue. For users, it means a better overall experience. Additionally, more votes for validators and delegators lead to higher revenues from SOL issuance, while for users, this results in a more stable consensus.
The analysis, supported by the Flipside Crypto dashboard, underscores Frankendancer’s data-driven edge in transaction processing, CU efficiency, and reward potential.
A huge thanks to Amin, Cooper, Hannes, Jacob, Michael, Norbert, Omer, and Teemu for sharing their feedback on the model and the article (this doesn’t mean they agree with the presented numbers!).
Zero-knowledge proofs are entering a period of rapid growth and widespread adoption. The core technology has been battle-tested, and we have begun to see the emergence of new services and more advanced use cases. These include outsourcing of proof computation from centralized servers, which opens the door to new revenue-generating opportunities for crypto infrastructure providers.
How significant could this revenue become? This article explores the proving ecosystem and estimates the market size in the coming years. But first, let’s start by revisiting the fundamentals.
ZK proofs are cryptographic tools that prove a computation's results are correct without revealing the underlying data or re-running the computation.
There are two main types of zk proofs:
A zk proof needs to be generated and verified. Typically, a prover contract sends the proof and the computation result to a verifier contract, which outputs a "yes" or "no" to confirm validity. While verification is easy and cheap, generating proofs is compute-intensive.
Proving is expensive because it needs significant computing power to 1) translate programs into polynomials and 2) run the programs expressed as polynomials, which requires performing complex mathematical operations.
This section overviews the current zk landscape, focusing on project types and their influence on proof generation demand.
Demand Side
Supply Side
For the privacy-focused rollup Aztec, only one proof per transaction will be generated in the browser, as depicted in the proving tree below. A similar dynamic is expected with other projects.

Monetization strategies will include fees and token incentives.
The primary revenue model will rely on charging base fees. These should cover the compute costs of proof generation. Prioritization of proving work will likely require paying optional priority fees.
The demand side and proving marketplaces will offer native token incentives to provers. These incentives are expected to be substantial and initially exceed the market size of proving fees.
To understand the proving market, we can draw analogies with the proof-of-stake (PoS) and proof-of-work (PoW) markets. Let’s examine how these comparisons hold up.
At the beginning of 2025, the PoS market is worth $16.3 billion, with the overall crypto market cap around $3.2 trillion. Assuming validators earn 5% of staking rewards, the staking market would represent approximately $815 million. This excludes priority fees and MEV rewards, which can be a significant part of validator revenues.
PoS characteristics have some similarities to zk-proving:
The PoW market can be roughly gauged using Bitcoin’s inflation rate, which is expected to be 0.84% in 2025. With a $2 trillion BTC market cap, this amounts to around $16.8 billion annually, excluding priority fees.
Both zk-proving and PoW rely on hardware, but they take different approaches. While PoW uses a “winner-takes-all” model, zk-proving creates a steady stream of proofs, resulting in more predictable earnings. This makes zk-proving less dependent on highly specialized hardware compared to Bitcoin mining.
The adoption of specialized hardware, like ASICs and FPGAs, for zk-proving will largely depend on the crypto market’s volume. Higher volumes are likely to encourage more investment in these technologies.
With these dynamics in mind, we can explore the revenue potential zk-proving represents.
Our analysis will be based on the Analyzing and Benchmarking ZK-Rollups paper, which benchmarks zkSync and Polygon zkEVM on various metrics, including proving time.
While the paper benchmarks zkSync Era and Polygon zkEVM, our analysis will focus on zkSync due to its more significant transaction volumes (230M per year vs. 5.5M for Polygon zkEVM). At higher transaction volumes, Polygon zkEVM has comparable costs to zkSync ($0.004 per transaction).
Approach
Results
A single Nvidia L4 GPU can prove a batch of ~4,000 transactions on zkSync in 9.5 hours. Given that zkSync submits a new batch to L1 every 10 minutes, around 57 NVIDIA L4 GPUs are required to keep up with this pace.
Proof Generation Cost
Knowing the compute time, we can calculate proving costs per batch, proof, and transaction:
The above calculations can be followed in detail in Proving Market Estimate(rows 1-29).
Proving costs depend on the efficiency of hardware and proof systems. The hardware costs can be optimized by, for example, using bare metal machines.
2024: Current Costs
2025: Optimizations Begin
2030: Proving costs fall to $0.001 per transaction across all rollups.

2024: Real Data
The number of transactions generated by rollups and other demand sources:
2025: Market Takes Off
The proving market begins to gain momentum. Estimated number of transactions: ~4.4B, including:
2030: zk-Proving at Scale
Proving will have reached widespread adoption. Estimated number of transactions: ~600B

We estimate the proving surplus based on previously estimated proving costs. This surplus is revenue from base and priority fees minus hardware costs. As the market matures, base fees and proving costs decrease, but priority fees will be a significant revenue driver.
Token incentives add further value boost, While it’s difficult to foresee the size of these investments, the estimate is based on the information collected from the projects.
2024: Early Market
2025: Expanding Demand
The total market is projected at $97M, including:
2030: Almost a Two-Billion-Dollar Market
The total zk-proving market opportunity is estimated at $1.34B.

A detailed analysis supporting the calculations is available in Proving Market Estimate(rows 32-57).
The estimates with so many variables and for such a long term will always have a margin of error. To support the main conclusion, we include a sensitivity analysis that presents other potential outcomes in 2025 and 2030 based on different transaction volumes and proving surplus. For the sake of simplicity, we left the proving costs intact at $0.059 and $0.001 per transaction in 2025 and 2030, respectively.
In 2025, the most pessimistic scenario estimates a total market value of just $12.5M, with less than a 10% proving surplus and 2B transactions. Conversely, the ultra-optimistic scenario imagines the market at $55M, based on a 50% surplus and 6B transactions.

In 2030, if things don’t go well, we could see a proving market of roughly $300M, from 10% proving surplus and 300B transactions. The best outcome assumes a $1.7B market based on a 90% surplus and 900B transactions.

Estimating so far into the future comes with inherent uncertainties. Below are potential error factors categorized into downside and upside scenarios:
Downside
Upside
After PoW and PoS, zk is the next-generation crypto technology that complements its predecessors. Comparing proving revenue opportunities with PoW or PoS is tricky because they serve different purposes. Still, for context:
We estimated that the zk-proving market could grow to $97M by 2025 and $1.34B by 2030. While these estimates are more of an educated guess, they’re meant to point out the trends and factors anyone interested in this space should monitor. These factors include:
Let’s revisit these forecasts a year from now.
A special thanks to Vishal from Multicoin and Max from Anza for their insights and discussions on this proposal.
Main Dashboard:
Token emission mechanisms play a critical role in the economic security and long-term sustainability of blockchain networks. In the case of Solana, the current fixed emission schedule operates independently of network dynamics, potentially leading to inefficiencies in staking participation, liquidity allocation, and overall network incentives. This proposal introduces a market-based emission mechanism that dynamically adjusts SOL issuance in response to fluctuations in staking participation.
The rationale for this adjustment is twofold: first, to enhance network security by ensuring that validator incentives remain sufficient under varying staking conditions, and second, to foster a more efficient allocation of capital within the Solana ecosystem, particularly in the DeFi sector. By linking token issuance to staking participation, the proposed model aims to mitigate the adverse effects of fixed inflation, such as excessive dilution of non-staking participants and unnecessary selling pressure on SOL.
SIMD228 introduces a dynamic adjustment mechanism based on staking participation. The model replaces the fixed emissions schedule with a function that responds to the fraction of the total SOL supply staked. The equation describing the new issuance rate is:

where r is the current emission curve, s is the fraction of total SOL supply staked, and


The issuance rate becomes more aggressive at around 0.5 of the total supply staked to encourage dynamic equilibrium around that point. Indeed, the multiplier of the current emission curve r shifts from ~0.70 at 0.4 to ~0.29 at 0.5. This means that, at a fraction of the total supply staked of 0.4, the new model mints ~70% of current inflation, at 0.5 just ~29% instead.
The corresponding APR from staking is represented below.

Despite the 0.5 shift seeming arbitrary, only data can adequately assess the real stake rate to trigger. We don’t have data we can use to understand the dynamic of SOL stakers due to issuance since the current issuance is stake-insensitive.
However, other ecosystems trigger inflation based on staking participation to have a fixed staking rate, balancing network usage and chain security. A prominent example of this is the Cosmos Hub. However, although Cosmos aims for 67% of the total supply staked, actual user behavior depends on network usage. For example, the Hub - meant to be a hub for security - has a current bonded amount of 57%. Also Ethereum has an issuance that depends on the amount of staked ETH, that at the time of writing is at 27.57%.
Some may argue that having an issuance rate that fluctuates can make returns on staked assets unpredictable. However, we believe that is just a matter of where the new equilibrium will be.
That said, it is hard to tell if 50% of the total supply staked is what Solana needs to grow with a healthy ecosystem. Thus, we believe 50% is no better or worse than any other sensible number to trigger “aggressiveness” since security is based on price. Indeed, a chain can be considered secure if the cost to attack it (Ca) is greater than the profit (P)

Currently, Solana's inflation schedule follows an exponential decay model, where the inflation rate decreases annually by a fixed disinflation rate (15%) until it reaches the long-term target of 1.5%. This model was adopted in February 2021, with the inflation rate reaching 4.6% as of February 2025 (cfr. ref). To achieve smooth disinflation, current issuance decreases by ~0.0889% per epoch until it reaches its long-term target.


The current curve is not sensitive to any shift in stake behavior; the only change is happening at the APR level. Indeed, the APR for a perfectly performing validator is

The current curve discourages a staking dynamic, with the sole aim of diluting the value of those who do not stake independently from the fraction of the total supply staked. This implies a dynamical change influenced by time rather than network needs.
It’s clear that to understand if Solana needs a change in the inflation model, we must assess how the current model influences the network's activity.
Our first consideration regards the dynamic evolution of the stake ratio. As we can see, despite decreasing over time, it shows a period of stillness, moving sidewise and confined in specific regions. Examples of this are epochs’ ranges [400, 550] and [650, 740], where the stake rate stays between [0.7, 0.75] and [0.65, 0.70], respectively, cfr. here. Notably, assuming epochs last for ~2 days, both periods are comparable with a year length.

Despite the prolonged static behavior, the stake rate shows a strong correlation with inflation (correlation coefficient of 0.78), meaning that when inflation decreases, the stake rate also decreases.

Since inflation is insensitive to the staking rate, the slow change in inflation triggers a shift in the fraction of total SOL staked. This indicates a willingness of users to move stake only when dilution for non-stakers decreases.
To assess if non-staked SOL moves into DeFi, we can study the elasticity of total value locked (TVL) over stake rate (SR)

where %ΔTVL is the percentage change in TVL in DeFi, and %ΔSR is the percentage change in the stake rate.
Elasticity E, in this context, measures the responsiveness of the change in TVL in DeFi, to change in the staking participation. A negative value indicates that TVL and SR move in the opposite direction, meaning that the decrease in SR correlates with liquidity moving into DeFi.

We need to see an increase in TVL and a decrease in SR to have a hint that non-staked SOL moves into DeFi. However, the elasticity indicates a low correlation between the staking rate and TVL.
If we compare DeFi TVL on Solana and Ethereum, we see that Solana still has a lot of room to grow.

The difference between TVL stems from the lack of adoption of lending protocols on Solana, while DEXes are catching up.


If we focus on DEXs’ TVL per traded volume, we see how Solana results in a more efficient network when dealing with trading activity.

On the contrary, TVL per active user is still low, indicating users’ preference for low-TVL interactions, like trading.

This indicates users’ willingness to use the chain and points to a high potential for growth. However, combining this observation with the staking behavior, there could be friction in depositing capital into DeFi due to dilution.
This may be due to DeFi yields still low compared with staking. For example
The reason why SOL is needed for DeFi growth is its low volatility compared to other assets prone to price discovery (i.e. non-stablecoins). This property has several implications, like:
This makes SOL indispensable for growing DeFi activity, especially for DEX liquidity provision for new projects launching their tokens.
In this section we have seen how DeFi grows because of externally injected capital. Further, the majority of TVL is locked in DEXs - with possible fictitious TVL into illiquid memecoins. Solana has 33% of TVL in DEXs, Ethereum just ~8%. Ethereum has 24% of TVL in Lending, Solana 13%. As a comparison, at the time of writing, just on AAVE you have 2% of ETH supply, on Kamino + Solend you have just 0.2% of SOL supply.
A key argument in favor of SIMD-228, as articulated by Anza researcher Max Resnick in his recent X article, is that inflation within the Solana network functions as a "leaky bucket," resulting in substantial financial inefficiencies. The theory contends that the current excessive issuance of SOL, approximately 28M SOL per year valued at $4.7B at current prices, leads to significant losses for SOL holders, including stakers, due to the siphoning of funds by governments and intermediaries.

Specifically, the theory highlights U.S. tax policies that treat staking rewards as ordinary income, subjecting them to a top tax rate of 37%—considerably higher than the 20% long-term capital gains rate—creating a "leaky bucket" effect that erodes value. Additionally, Resnick points to the role of powerful centralized exchanges like Binance and Coinbase, which leverage their market dominance to impose high commissions, such as 8%, on staking rewards, further draining resources from the network. The conclusion is that, by reducing inflation through SIMD-228, Solana could save between $100M and $400M annually, depending on the degree of leakage, thereby aligning with the network's ethos of optimization.
The current snapshot seems to point to an overpayment for security. Indeed, the current SOL staked value amounts to ~$53B, which is securing a TVL of ~$15B. Since the cost to control Solana is 66% of SOL staked, we have ~$35B securing ~$15B. However, it’s a common misconception that is the current 4.6% of inflation that determines the overpayment, leading to a ~28M SOL minted per year, or $4B at today's prices. This has nothing to do with security overpayment, and other ecosystems like Ethereum prints ~$8B for securing the network.
Our task is then to assess under which condition the overpayment statement holds. To assess if the current curve is prone to overpayment of security, we need to study the evolution of the parameters involved. This is not an easy task and each model is prone to interpretation. However, based on the above data, we can build a simple dynamical model to quantify the “overpaying” claim.
The model is meant to be a toy-model showing how the current curve (pre-SIMD228) can guarantee the security of the chain, overpaying for security based on different growth assumptions. The main idea is to assess security as the condition described in Eq. (3), where the profit is estimated assuming an attacker can drain the whole TVL. In this way, the chain can be considered secure provided that

which define the security ratio.
In our model we consider the stake rate decreasing by 0.05 each 150 epochs, based on the observation done in the previous section. We further consider an amount of burnt SOL per epoch of 1,800 SOL (cfr. Solana Transaction Analysis Dashboard), and a minimum stake rate of 0.33.
The first case we want to study is when TVL grows faster than SOL price. We assumed the following growth rates:
The dynamical evolution obtained as an outcome of these assumptions is depicted below.

We can see how, with the assumed growth rate, the current inflation curve guarantees a secure chain up to 2.5 years. Notably, this happens at a stake rate of 0.5 and SOL price slightly below SOL ATH. This corresponds to an inflation rate of 3% and an APR of 6.12%. After this point, the curve is not diluting enough non-staked capital to bring back the chain at security level.
Of course, changing the growth rates for DeFi’s TVL and SOL price changes the outcome, and we don’t have a crystal ball to say what will happen 10 years from now. For example, just assuming a SOL price growth higher than the TVL growth, the current curve results in a 10 years of overpayment for security.

This model shows how the current overpayment for security can drastically change over time, based on different growth assumptions. To enable the reader to draw their conclusions, we have built a dashboard that allows users to modify our assumptions and analyze the impact of adjusting various growth parameters. The dashboard is available here.
Solana requires beefy machines to run well. This is because there is a dilution of stake for non-optimally performing validators, decreasing their APR in favor of top-performing validators (see, e.g., here and here).
For example, let’s consider that 60% of the stake has an uptime of 99.8% — i.e., 60% of the stake has a TVC effectiveness of 99.8% — while 40% of the stake has an uptime of 95%. When accounting for APR share, we have a multiplier of

meaning 99.8% of the stake takes 61.1% of the total APR (i.e., of inflation) at the expense of the non-optimally performing 40% of the stake.
Despite this being in line with Solana's needs for top-performing validators, such a mechanism implies higher costs for validators. These machines are relatively expensive, ranging from $900/month to $1,500/month. To ensure that a validator can continue to validate when a machine fails or needs to reboot, a professional node operator needs two machines per validator identity. Furthermore, Solana uses a lot of network bandwidth. The costs vary by vendor and location, estimated at $100–200 per month. On top of that, there are voting costs of around 2 SOL a day. Assuming a SOL price of $160, this corresponds to an overall cost of between $128,800 and $137,200 a year. This is without accounting for engineering costs!
Assuming an 8% commission on staking rewards, a validator with 0.1% of stake needs — at 1 SOL = $160 — an APR ranging between 2.60% and 2.77% to break even. However, at the current staking rate, SIMD228 pushes the APR to 1.40%, making 1,193 out of 1,317 validators unprofitable from sole inflation. Clearly, lowering SOL price changes the APR needed to break even!
It is worth noting that, if SIMD228 is implemented in a year from now, assuming a stake rate of 0.5, the current curve would produce an APR of ~6%. At the same level of stake rate, the proposed curve would produce an APR of ~2%.
If we analyze the distribution of commission dividing validators by cohorts, we see that 50% of validators with less than 0.05% of stake have commissions higher than zero, and 40% of validators with stake share between 0.05% and 0.5% have commissions higher than zero. Here cohorts are defined as

If we look at the Cohorts’ dynamical evolution, we can see how the median of Cohort 3 started to adopt 0 commissions around epoch 600 (Apr 9, 2024), meanwhile Cohort 4 just started to opt for this solution recently. Cohort 1 and 2 are more stable with time. This is a clear sign that commissions are set based on market conditions, probably indicating that these are zero when value extracted from MEV and fees is enough to guarantee profitability.

This ties validator revenues to MEV and network fees, making the fraction of total supply staked a parameter highly dependent on the market and broader network activity.


Indeed, these add extra revenue to stakers, and there is no need for higher inflation. However, this assumes fairness among MEV and fee share, but we know these are long-tailed distributions. This property implies that having a higher stake unfairly exposes bigger validators to a higher likelihood of being leaders of juicier blocks.
By considering the distribution of MEV and fees from the start of the year, we can run simulations to see the effect of stake share on this “Market APR.”

From the plot above, it’s clear that low stake has a higher variance and lower median, incurring a non-null probability of ending the year with a low-generated Market APR. Considering that most of the revenues come from MEV and most are shared with delegators, the dynamic around it could enhance centralization. Other possibilities are
It is also worth noting that the simulations above are highly optimistic since they include MEV and PF from the January “craziness”. By excluding those very profitable days, we have a smaller Market APR.

This is still eventually optimistic, since at time of writing - epoch 747 - APR from Fees and MEV is respectively at 0.79% from fee and 1%. If we run simulations considering just data from the end of February we have an overall market APR further decreasing.

Notoriously, low stake validators cut costs on machines, operating on non-performing infrastructures for the operation of Solana. This results in an overall lower TVC effectiveness and higher skip rate. The first has an impact on network APR, requiring a higher APR to make profits. The second, instead, has implications on extracted Market APR, exacerbating the “MEV unfairness” between stake shares.


Another risk we see is that the market APR per staked SOL will drastically increase if there is a shock in fraction of staked SOL. Despite the amount of MEV and fees depending on block proposals, and then from the share of staked SOL, the relative gain per SOL depends on the SOL staked. In other words, a share of staked SOL of 1%, S1, produces on average M from MEV and fees. If the fraction of SOL staked goes down, the same share of 1%, this time S2, still makes M from MEV, this time with S2< S1. Since, M/S1 < M/S2, revenue for staked SOL increase. This behaviour is depicted in the image below - fixed share of staked SOL of 1%.

Despite this seems to be a point in favour of aggressively lowering issuance, we think that, combined with the risks of encouraging “bad” MEV to increase proceeds, this may lead to more staked capital used to frontrun users.
This makes Solana vulnerable to dilution from bad actors, since APR for staked SOL coming from market activity will be drastically higher than APR from inflation. This is risky because you can now make more profits in relative terms from MEV. Put it simply, larger actors can accumulate SOL with discounts coming from unstaking.
However, it is worth mentioning that, assuming a period of ~200 epochs to see SIMD228 implemented and a stake rate of 0.4, the proposed curve produces an APR of 6.47%, meaning that the effect induced by MEV is mitigated.
Introducing a market-based emission mechanism for Solana represents a fundamental shift from a fixed issuance schedule to a dynamic, staking-sensitive model. This proposal aims to align SOL issuance with actual network conditions, optimizing security incentives, removing unnecessary inflationary pressure, and fostering ecosystem growth. By adjusting emissions based on the fraction of total SOL supply staked, the model seeks to maintain an equilibrium that balances validator rewards with broader economic activity within the Solana ecosystem.
The analysis highlights key insights regarding the rigidity of the current staking rate, its correlation with inflation, and the limited elasticity between staking and Total Value Locked (TVL) in DeFi. The findings suggest that Solana's existing inflation structure primarily dilutes non-stakers rather than dynamically responding to network needs. Moreover, despite the increasing role of MEV and transaction fees in validator revenues, the distribution remains skewed, raising concerns about potential centralization effects under the new regime.
While the proposal addresses inefficiencies in capital allocation, its impact on validator sustainability remains a critical concern. The simulations indicate that under SIMD-228, a significant fraction of validators may become unprofitable, making revenue generation more dependent on MEV and network fees. This shift introduces new risks, including possible off-chain agreements to manipulate MEV distribution or incentives for adverse behaviors.
In conclusion, while SIMD-228 introduces a more responsive and theoretically efficient emission mechanism, its broader implications on validator economics, staking participation, and DeFi liquidity require further empirical validation. Although we believe that dynamical inflation tied to the fraction of the total supply staked is more aligned with network needs, we advocate a less aggressive reduction in order to make overall validator profitability less dependent on market conditions, reducing security issues. This less aggressive reduction may be achieved if SIMD228 takes around a year to be implemented.
Solana processes thousands of transactions per second, which creates intense competition for transaction inclusion in the limited space of a slot. The high throughput and low block time (~400ms) require transactions to be propagated, prioritized, and included in real-time.
High throughput on Solana comes with another advantage: low transaction costs. Transaction fees have been minimal, at just 0.000005 SOL per signature. While this benefits everyone, it comes with a minor trade-off—it makes spam inexpensive.
For end-users, spam means slower transaction finalization, higher costs, and unreliable performance. It can even halt the network with a DDoS attack, as in 2021, or with an NFT mint, as in 2022.
Against this backdrop, Solana introduced significant updates in 2022: stake-weighted quality of service (swQoS) and priority fees. Both are designed to ensure the network prioritizes higher-value transactions, albeit through different approaches.
Another piece of infrastructure that can help reduce transaction latency is Jito MEV. It enables users to send tips to validators in exchange for ensuring that transaction bundles are prioritized and processed by them.
This article will explore these solutions, break down their features, and assess their effectiveness in transaction landing latency.
Let’s start with a basic building block—a transaction.
Solana has two types of transactions: voting and non-voting (regular). Voting transactions achieve consensus, while non-voting transactions change the state of the network's accounts.
Solana transaction consists of several components that define how data is structured and processed on the blockchain¹:
A single transaction can have multiple accounts, instructions, and signatures.
Below is an example of a non-voting transaction, including the components mentioned above:

On Solana, a transaction can be initiated by a user or a smart contract (a program). Once initiated, the transaction is sent to an RPC node, which acts as a bridge between users, applications, and the blockchain.
The RPC node forwards the transaction to the current leader—a validator responsible for building the next block. Solana uses a leader schedule, where validators take turns proposing blocks. During their turn, the leader collects transactions and produces four consecutive blocks before passing the role to the next validator.
Validators and RPC nodes are two types of nodes on Solana. Validators actively participate in consensus by voting, while RPC nodes do not. Aside from this, their structure is effectively the same.
So, why are RPCs needed? They offload non-consensus tasks from validators, allowing validators to focus on voting. Meanwhile, RPC nodes handle interactions with applications and wallets, such as fetching balances, submitting transactions, and providing blockchain data.
The main difference is that validators are staked, securing the network, while RPC nodes are not.

After reaching the validator, the transactions are processed in a few stages, which include²³:

The transaction is considered confirmed if it is voted for by ⅔ of the total network stake. It is finalized after 31 blocks.
In this setup, all validators and RPC nodes compete for the same limited bandwidth to send transactions to leaders. This creates inefficiencies, as any node can overwhelm the leader by spamming more transactions than the leader can handle.
To improve network resilience and enhance user experience, Solana introduced QUIC, swQoS, and priority fees, as outlined in this December 2022 post:
With the adoption of the QUIC protocol, trusted connections between nodes are required to send transactions. The swQoS system prioritizes these connections based on stake. In this framework, non-staked RPC nodes have limited opportunities to send transactions directly to the leader. Instead, they primarily rely on staked validators to forward their transactions.
Technically, a validator must configure swQoS individually for each RPC node, establishing a trusted peer relationship. When this service is enabled, any packets the RPC node sends are treated as though they originate from the validator configuring swQoS.

Validators are allocated a portion of the leader’s bandwidth proportional to their stake. For example, a validator holding 1% of the total stake can send up to 1% of the transaction packets during each leader’s slot.
From the leader’s perspective, 80% of available connections are reserved for staked nodes, while the remaining 20% are allocated to RPC nodes. To qualify as a staked node, a validator must maintain a minimum stake of 15,000 SOL.
While swQoS does not guarantee immediate inclusion of all transactions, it significantly increases the likelihood of inclusion for transactions submitted through nodes connected to high-stake validators.
Priority fees serve the same role as swQoS by increasing the chances of transaction inclusion, though they use a completely different mechanism.
There are two types of fees on Solana⁵:
Of the total fees from a transaction, 50% is burned, while 50% is received by the leader processing the transaction. A proposal to award the validator 100% of the priority fee has been passed and is expected to be activated in 2025 (see SIMD-0096).
Priority fees help validators prioritize transactions, particularly during high congestion periods when many transactions compete for the leader's bandwidth. Since fees are collected before transactions are executed, even failed transactions pay them.
During the banking stage of Solana’s transaction processing, transactions are non-deterministically assigned to queues within different execution threads. Within each queue, transactions are ranked by their priority fee and arrival time⁶. While a higher priority fee doesn’t guarantee that a transaction will be executed first, it does increase its chances.
The final puzzle of transaction prioritization is Jito. This modified Solana client allows searchers to send tips to validators in exchange for including groups of transactions, known as bundles, in the next block.
It could be argued that the Jito infrastructure prioritizes transactions using a tipping mechanism, as users can send a single transaction with a tip to improve its chances of landing fast.
For a deeper explanation of how Jito works, check out our previous article on the Paladin bot, which provides more details.
We now have a clearer understanding of how all three solutions contribute to transaction inclusion and prioritization. But how do they affect latency? Let’s find out.
Methodology
To calculate the time to inclusion of a transaction, we measure the difference between the time it is included in a block and the time it is generated. On Solana, the generation time can be determined from the timestamp of the transaction’s recent blockhash. Transactions with a recent blockhash older than 150 slots—approximately 90 seconds—expire.
The latest blockhash is assigned to the transaction before it is signed, so transactions signed by bots will be included faster than transactions generated by normal users. This method is not perfect, but still allows us to collect valuable information about latency and user topology.
Other factors beyond the swQoS and priority fees, such as the geographical proximity of nodes to the leader or validator and RPC performance, also impact inclusion times—we are not fully accounting for those.
To reduce the possible biases, we consider only slots proposed by our main identity from November 18th to November 25th, 2024.
Time to Inclusion
The time to inclusion across all transactions, without any filtering, has a trimodal distribution suggesting at least three transaction types. The highest peak is at 63 seconds, followed by another at 17 seconds, and a smaller one is at 5 seconds.

The second and third peaks are likely from regular users. This double peak could occur because general users don't set maxRetries to zero when generating the transaction. The first peak, at around 5s, is probably related to bots, where the delay between generating and signing a transaction is marginally zero.
We can classify users based on their 95th percentile time to inclusion:

Most users fall into the “normal” and “slow” classifications. Only a small fraction of submitted transactions originate from “fast” users.
Let’s now break down transactions by source.
Priority Fee
Transactions can be categorized based on their priority fee (PF) with respect to the PF distribution in the corresponding slot. Precisely, we can compare the PF with the 95th percentile (95p) of the distribution:

The size of the priority fee generally doesn’t influence a transaction’s time to inclusion. There isn’t a clear threshold where transactions with higher PF are consistently included more quickly. The result remains stable even when accounting for PF per compute unit.
Jito Tippers
We can restrict the analysis to users sending transactions via the Jito MEV infrastructure, excluding addresses of known swQoS consumers. Interestingly, most Jito transactions originate from “slow” users.

We categorize tippers by siże of tips in the block, analogously to what we did for PF:
When we compute the probability density function (PDF) of time to inclusion based on this classification, we find that the tip size doesn’t significantly impact the time to inclusion, suggesting that to build a successful MEV bot, one doesn’t have to pay more in tips!

Within the Jito framework, a bundle can consist of:
In both cases, the time it takes for the entire bundle to be included is determined by the inclusion time of the tip transaction. However, when a tip is paid in a separate transaction, we don’t track the other leg. This reduction in volume explains why the PDF of tippers differs from that of Jito consumers.
swQoS
It’s impossible to fully disentangle transaction time to inclusion from swQoS for general users, meaning some transactions in the analysis may still utilize swQoS. However, we can classify users based on addresses associated with our swQoS clients.
When we do this and apply the defined user topology classification, it becomes clear that swQoS consumers experience significantly reduced times to inclusion.
The peak around 60 seconds is much smaller for swQoS consumers, indicating they are far less likely to face such high inclusion times

The highest impact of using swQoS is seen in the reduction of the time to inclusion for “slow” users. By computing the cumulative distribution function (CDF) for this time, we observe a 30% probability of these transactions being included in less than 13 seconds.

When comparing the corresponding CDFs:
'Normal' users also benefit from swQoS. There's an additional peak in the PDF for these users between 9s and 13s, showing that some of “normal” users process transactions in less than 20s. Additionally, another peak appears around 40s, indicating that part of the slower users now see their 95th percentile falling in the left tail end of 'normal' users. This suggests that the overall spread of the time-to-inclusion distribution is reduced.
There is no statistically significant difference between the analyzed samples for “fast” users. However, some Jito consumers may also use swQoS, which complicates the ability to draw definitive conclusions.
Despite this, the improvements for “slow” and “norma”' users highlights swQoS's positive impact on transaction inclusion times. If swQoS explains the PDF shape for “fast” users, it increases the likelihood of inclusion within 10s from ~30% to ~100%, a 3x improvement. A similar 3x improvement is observed for “slow” users being included within 13s.
Transaction inclusion is arguably Solana's most pressing challenge today. Efforts to address this have been made at the core protocol level with swQoS and priority fees and through third-party solutions like Jito (remembering that the main Jito use is MEV).
Solana’s latest motto is to increase throughput and reduce latency. In this article, we have examined how these three solutions improve landing time. Or, more simply, do they actually reduce latency? We found out that:
Among the three, swQoS is the most reliable for reducing latency. Jito and priority fees can be used when the time to inclusion is less important.
References:
About Chorus One
Chorus One is one of the largest institutional staking providers globally, operating infrastructure for over 60 Proof-of-Stake (PoS) networks, including Ethereum, Cosmos, Solana, Avalanche, Near, and others. Since 2018, we have been at the forefront of the PoS industry, offering easy-to-use, enterprise-grade staking solutions, conducting industry-leading research, and investing in innovative protocols through Chorus One Ventures. As an ISO 27001 certified provider, Chorus One also offers slashing and double-signing insurance to its institutional clients. For more information, visit chorus.one or follow us on LinkedIn, X (formerly Twitter), and Telegram.

.png)


